
Figure 1.
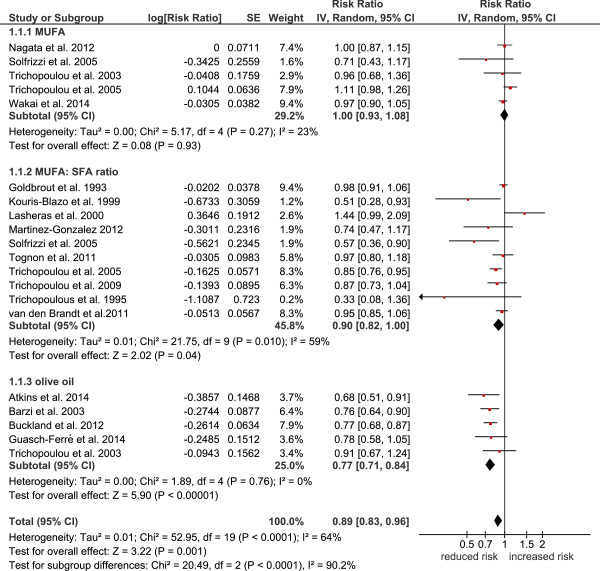
Forest plot showing pooled relative risks (RRs) with 95% CI for all-cause mortality comparing the top versus bottom third of the distribution of MUFA, MUFA:SFA ratio, olive oil, and oleic acid. I2: Inconsistency; MUFA: monounsaturated fatty acids; SE: standard error; SFA: saturated fatty acids.