
Figure 14.
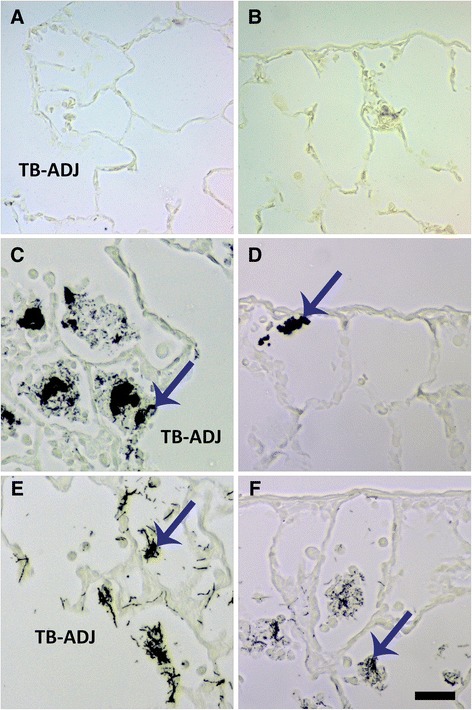
Ag NW in lung tissues at Day 1. Images are of autometallography -stained slides in the terminal bronchiole-alveolar duct junction [(TB-ADJ) A, C, E], and pleural regions (B, D, F). Tissues were obtained 1 day post instillation of sham control (A-B), S-Ag NWs (C-D), or L-Ag NWs (E-F) at 1.0 ml/kg. Ag NWs are indicated by blue arrows. Panels are Brightfield microscopy images. Scale bar is 25 μm.