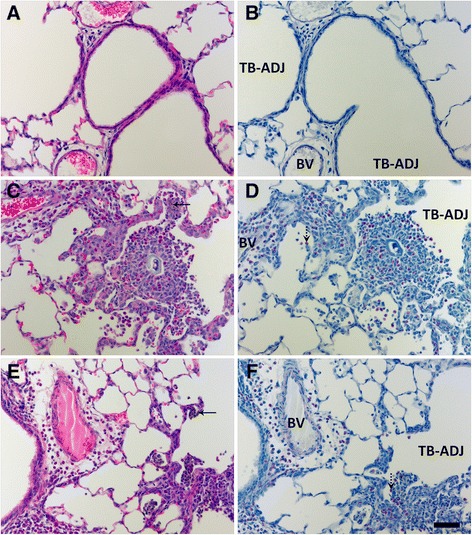
Figure 8.

At Day 1, Ag NW instillation produced marked inflammation in regions adjacent to particle agglomerates. Images are from serial tissue sections stained with H & E (left) or CEM (right) stains, and recovered at 1 day post exposure to sham control (A-B), S-Ag NWs (C-D), or L-Ag NWs (E-F) Panels are Brightfield microscopy images of tissues from rats instilled with a single 0.5 ml/kg dose of sham control or Ag NWs (indicated by solid arrows). Broken arrows indicate eosinophils, which are bright pink in H & E and CEM panels. BV = blood vessel, and TB-ADJ = terminal bronchiole-alveolar duct junction. Scale bar is 50 μm.
