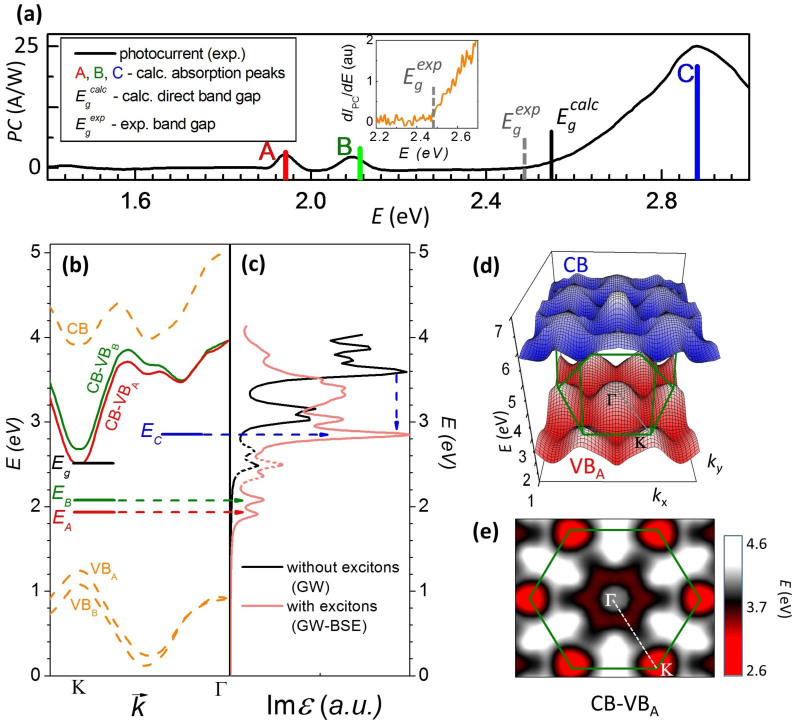
Figure 2. Probing excitons in pristine monolayer MoS2 through photocurrent spectroscopy.
(a) PC spectrum of an intrinsic suspended unannealed 1L-MoS2 device #2 acquired at Vds = 6 V. Background photocurrent due to the surface photovoltage was subtracted (Supplementary Information, S3). Calculated positions of excitonic A-, B- and C-peaks and band gap Eg are shown as colored vertical bars. The bar height represents peaks amplitudes. The inset: derivative of the photocurrent plotted vs. the photon energy. (b) Electronic and optical band structures of 1L-MoS2 along the K-Γ direction. The solid horizontal lines are the estimated positions of the excitonic bound states. (c) Optical spectrum of MoS2 calculated with and without excitonic effects. The dashed peaks between 2.2 eV and 2.7 eV are computational artifacts, which are discussed in the Supplementary Information, S6. Vertical blue arrow indicates the position of the van Hove singularity downshifted by excitonic effects. (d) Three-dimensional plot of the band structure of MoS2. (e) The colorplot of the optical band structure of MoS2. Dark red gear shaped region around Γ is the local minimum corresponding to the excitonic C-peak.

