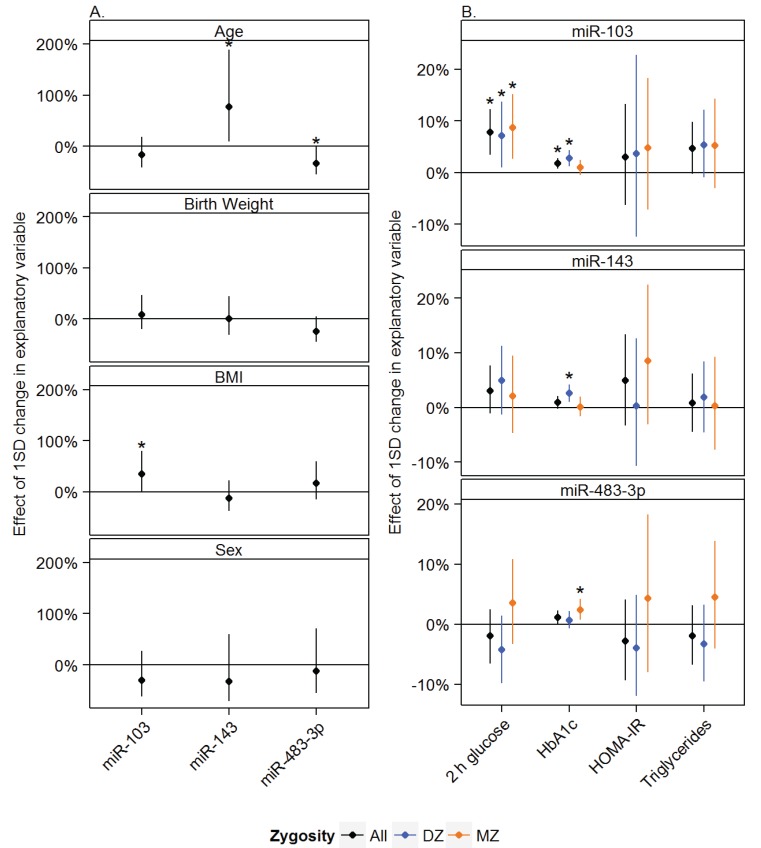
Figure 1.
Multivariate analyses were performed to study the association between (A) age, birth weight, BMI and sex and miR-103, miR-143 and miR-483-3p expression in adipose tissue from elderly twins and the association between (B) miR-103, miR-143 and miR-483-3p and 2 h glucose values after an oral glucose tolerance test, hemoglobin A1c (HbA1c), homeostatic model assessment of insulin resistance (HOMA-IR) and triglycerides shown for all subjects (black), dizygotic (DZ) twins (blue) and monozygotic (MZ) twins (orange). Effect measures were transformed to percent wise changes per standard deviation (SD). Mean effects are shown by ●. Error bars represent the 95% confidence interval. All analyses were adjusted for age, sex and BMI. In addition the analyses of age, BMI and sex were adjusted for birth weight. Analyses involving all subjects (black) were additionally adjusted for twin and zygosity status. A p-value of ≤0.05 was considered significant, and is indicated by *. Body mass index (BMI), plasma glucose measured at 2 h in an oral glucose tolerance test (2 h glucose), homeostatic model assessment of insulin resistance (HOMA-IR), hemoglobin A1c (HbA1c).

