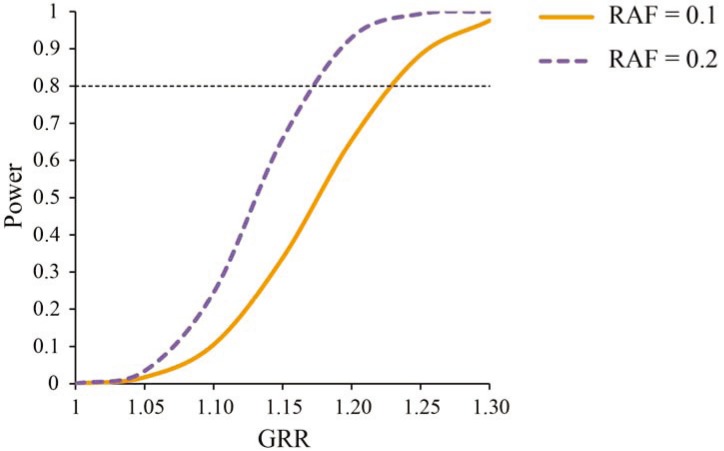
Figure 1.
Statistical power to detect gene sets in the Psychiatric Genomics Consortium (PGC) Attention Deficit/Hyperactivity Disorder (ADHD) sample. Power is displayed for different genotype relative risks (GRR), and risk allele frequencies (RAF) of 0.1 and 0.2. The weighted mean of the noncentrality parameters of the case-control sample (896 cases and 2455 controls) and trio sample (2064 trios) was used to calculate power. Power analyses assume a disease prevalence of 5% and a multiplicative model. We assumed that gene sets behave as individual single nucleotide polymorphisms (SNPs). Tests are corrected for number of gene sets (α = 2.8 × 10⁻³). Dotted horizontal line represents power of 0.80.

