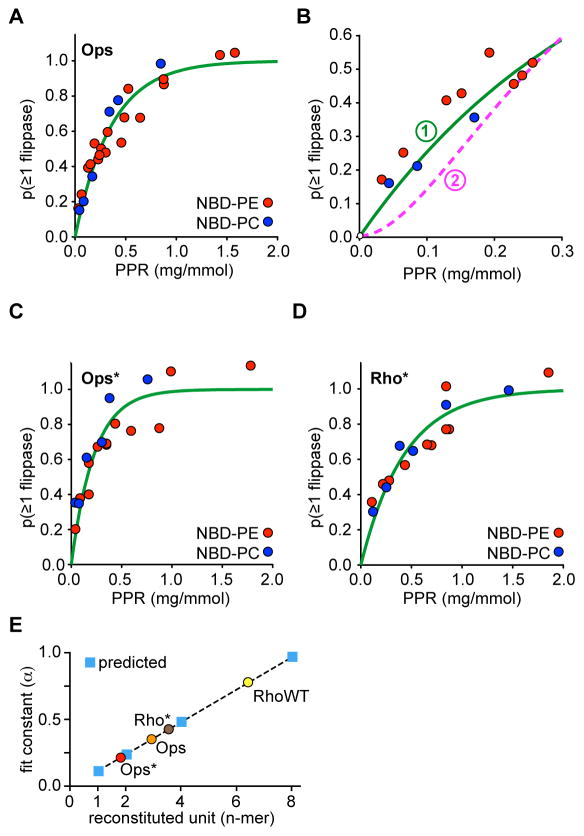
Figure 3. Protein-dependence of Ops Ops* and Rho*-mediated phospholipid scrambling.
A, Scramblase activity assays (as in Figure 2B) were done with Ops-proteoliposomes prepared with different PPRs using NBD-PE and NBD-PC reporters. The fluorescence reduction data were transformed as described in ‘Methods’13 in order to plot the probability of a vesicle having at least 1 scramblase, p(≥1 scramblase), versus PPR. The green line through the points is a mono-exponential fit of the cumulative data.
B, Data from A were fit to either of two analytical expressions, each with a single fit parameter (α), that describe alternative reconstitution scenarios: a single reconstitution event directly confers scramblase activity to the vesicle ((p(≥1 scramblase) = 1 − exp(−PPR/α)), or, two or more reconstitution events are required to confer scramblase activity to a vesicle (p(≥1 scramblase) = 1 − (1 + PPR/α) exp(−PPR/α)). The resultant fit constants were α = 0.36 (green line) and 0.16 (pink dashed line) mg/mmol, respectively, with corresponding χ2 values of 0.15 and 0.35. Thus, the data were better fit by a single exponential consistent with functional scramblase-equipped vesicles being generated via single reconstitution events.
C, as in A, for Ops*.
D, as in A, for Rho*.
E, Graph of the fit constant α for the equation p(≥1 scramblase) = 1 − exp(−PPR/α) as a function of the size of the multimer being reconstituted (n-mer). Predicted values for the reconstitution of opsin monomers, dimers, tetramers and octamers are shown as blue squares (the dashed line connecting the squares is intended to guide the eye). Measured fit constants for Ops, Ops* and Rho* (taken from the data in panels A, C and D) are indicated by filled circles.

