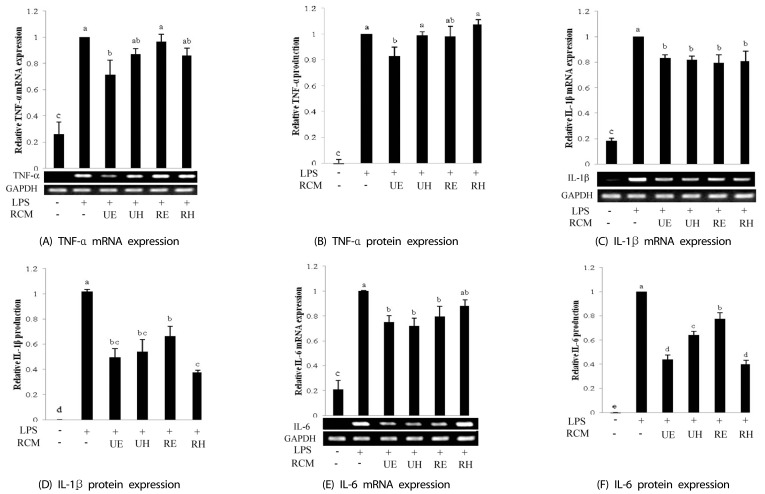
Fig. 4.
Effect of RCM on TNF-α (A and B), IL-1β (C and D), and IL-6 (E and F) mRNA and protein expression. Cells were pretreated with 400 µg/ml concentration of RCM for 24 h then stimulated with LPS (1 µg/ml) for 4 or 16 h. Total RNA and protein lysates were subjected to semi-quantitative PCR or Western blot analysis. The values are expressed as the mean ± S.D. of three individual experiments. Values not sharing the same letter were significantly different (P < 0.05). (UE: unripe Rubus coreanus Miquel ethanol extract, UH: unripe Rubus coreanus Miquel water extract, RE: ripe Rubus coreanus Miquel ethanol extract, and RH: ripe Rubus coreanus Miquel water extract)

