
Table 2.
Body weight, epidydimal fat pad weight, and food intake in mice fed the experimental diets
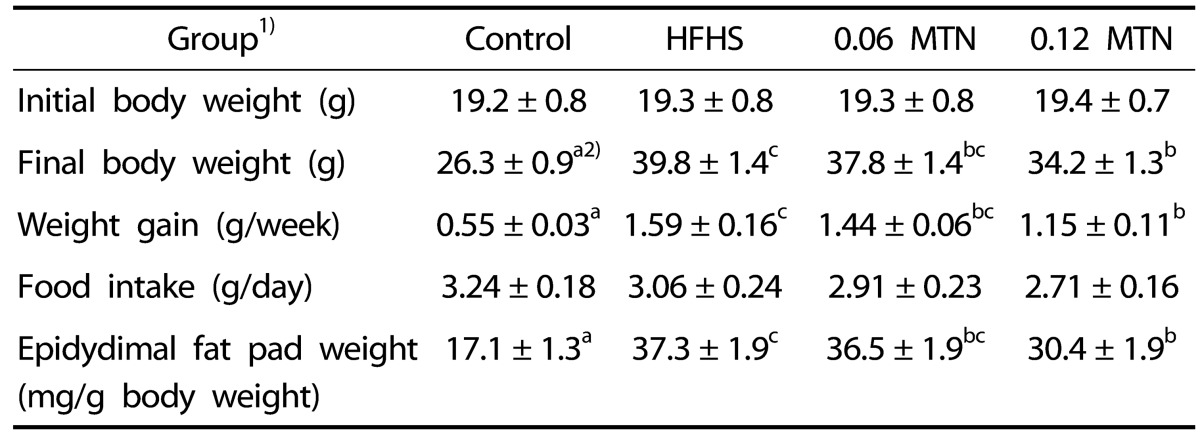
1) Control, mice fed the basal diet; HFHS, mice fed the high-fat, high-sucrose diet; 0.06 MTN, mice fed the HFHS diet containing 0.06% myricetin; 0.12 MTN, mice fed the HFHS diet containing 0.12% myricetin
2) Values are means ± SE (n = 7). Means in the same row not sharing a common letter are significantly different at P < 0.05.