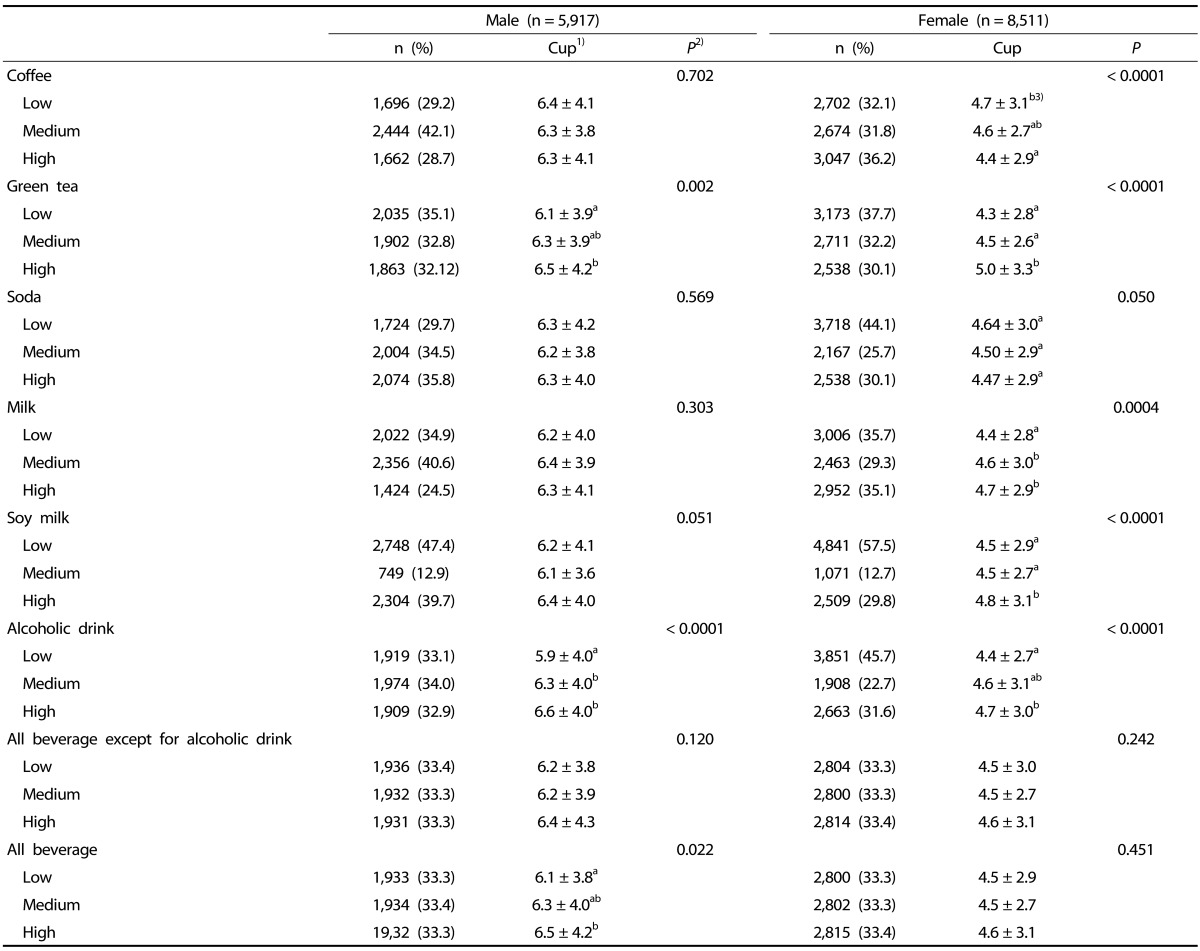
Table 5.
Water intake of subjects according to frequencies of beverage and alcoholic drink consumption estimated by the qualitative food frequency questionnaire

1)1 cup = 200 ml.
2)P-values by one-way ANOVA for continuous variables.
3)a,b,cMean values within a column with unlike superscript letters were significantly different (P < 0.05) according to Tukey's multiple comparison test.
