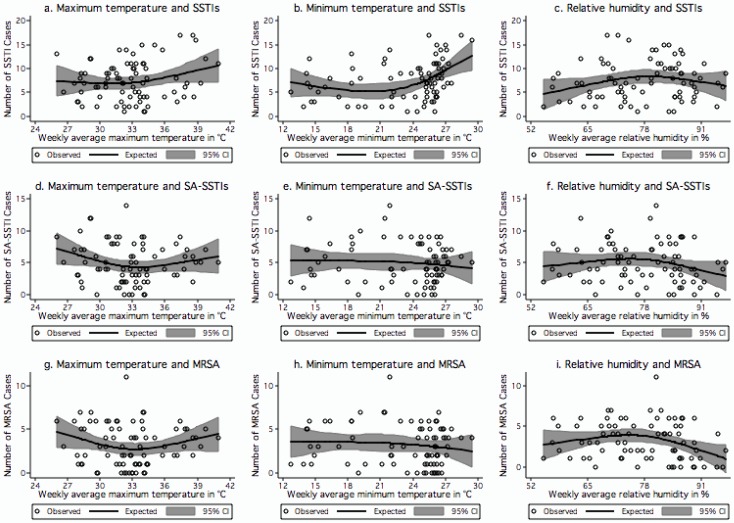
Figure 1.
(a–i) Relationships between climatic factors and skin and soft-tissue infections (SSTIs), skin and soft-tissue infections caused by S. aureus (SA-SSTIs) and SSTIs caused by MRSA. (a) Weekly average maximum temperature and SSTIs; (b) Weekly average minimum temperature and SSTIs; (c) Weekly average relative humidity and SSTIs; (d) Weekly average maximum temperature and SA-SSTIs; (e) Weekly average minimum temperature and SA-SSTIs; (f) Weekly average relative humidity and SA-SSTIs; (g) Weekly average maximum temperature and MRSA; (h) Weekly average minimum temperature and MRSA; and (i) Weekly average relative humidity and MRSA. The centre lines in the graphs show the estimated spline curve, and the upper and lower lines represent the 95% confidence limits.

