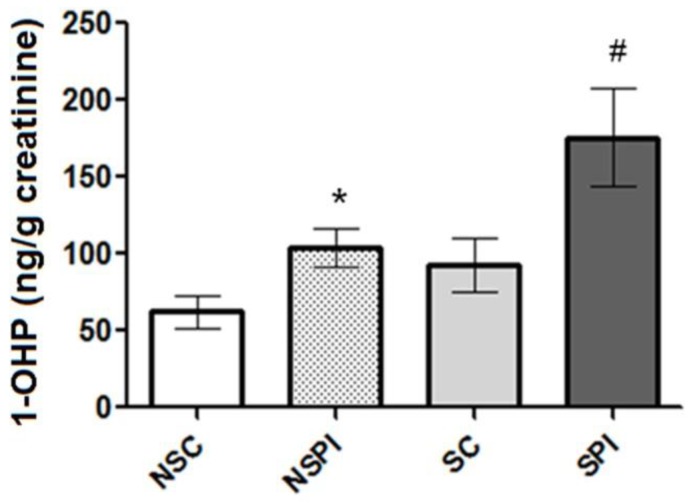
Figure 2.
Urinary 1-hydroxypyrene (1-OHP) levels observed in the groups of study. Results are expressed as mean ± SE (standard error). NSC (non-smoker controls); NSPI (non-smoker post-infarction subjects); SC (smoker controls); SPI (smoker post-infarction subjects). * p < 0.01 for non-smokers (post-infarction compared to control). # p < 0.01 for smokers (post-infarction compared to control).

