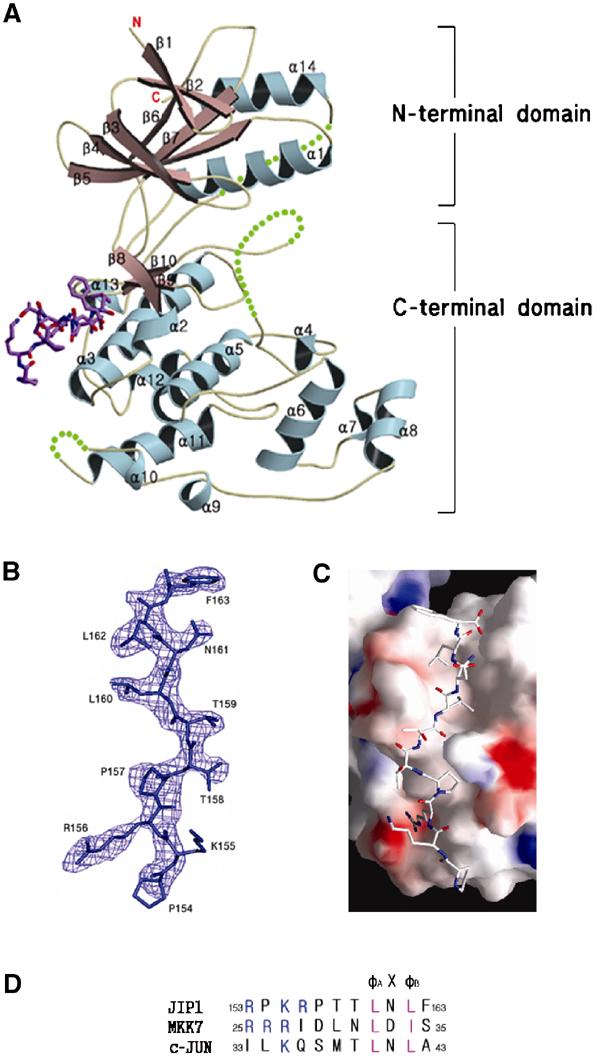
Figure 1.

Overall structure of JNK1 complexed with pepJIP1 at a resolution of 2.35 Å. (A) JNK1 is shown in a ribbon model and the disordered regions of JNK1 (residues 173–189, 282–286, and 337–348) are expressed as dotted lines. The bound pepJIP1 is shown in a stick model of atomic color. The regions for the N- and C-terminal domains are indicated. (B) The sigma-A-weighted 2Fo–Fc electron density map calculated with a final refined model without pepJIP1 at a level of 1.2σ. The peptide used in the experiment is RPKRPTTLNLF, but the starting residue, Arg153, is not shown in the density. (C) Surface representation of JNK1 in complex with pepJIP1, colored by electrostatic potential. (D) The docking site sequences of the scaffolding protein (JIP1), the upstream kinase (MKK7), and the substrate transcription factor (c-jun), which are components of the JNK signaling regulated by JIP1 scaffolding protein. The basic residues and φ residues are shown in blue and violet letters, respectively.
