
Figure 2.
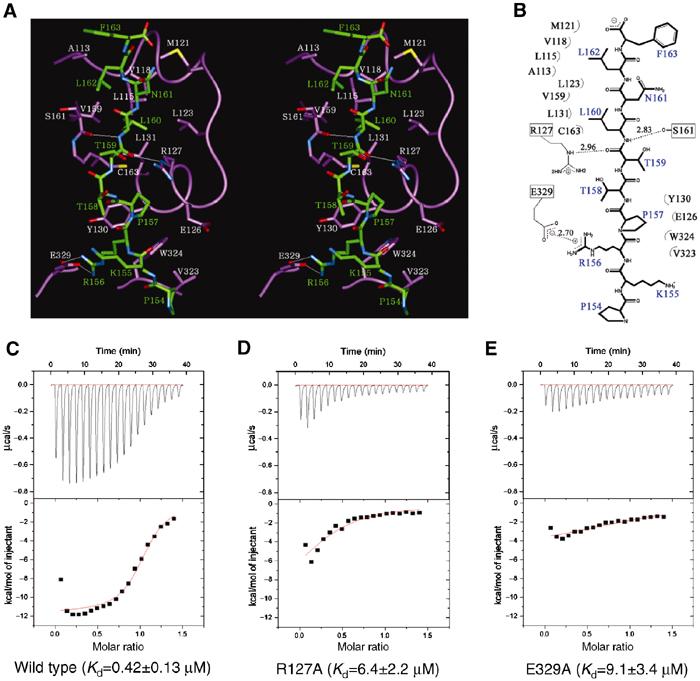
Interactions between JNK1 and pepJIP1. (A) Stereoview of the interactions between JNK1 (violet) and pepJIP1 (green). The residues of JNK1 involved in the interactions are shown in white labels and those of pepJIP1 in green labels. The hydrogen bonds in the interactions are shown as thin white lines. (B) Schematic expression of the interactions. (C) The binding affinity of pepJIP1 to wild-type JNK1 was measured by ITC. The upper panel shows the raw data, a trace of power with time. The lower panel shows the integrated heats from each injection, and the line through the measured points shows the best-fit model for a single binding site. (D, E) The respective Kd values of pepJIP1 to JNK1 mutants, R127A and E329A, were derived from the ITC data.