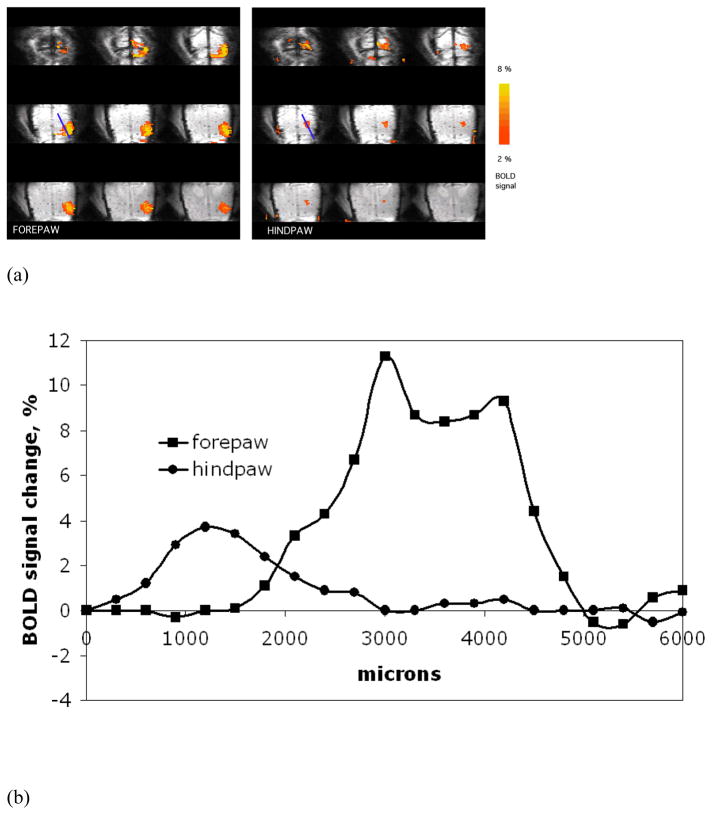
Fig. 4.
(A) Representative averaged forepaw and hindpaw activation maps overlaid upon averaged anatomical images are shown in axial orientation. Thirteen fMRI sessions, separately obtained for each limb from a single animal with the isotropic resolution of 300 μm (3D GE EPI), were averaged for the shown images and the activation maps. (B) BOLD signal profiles from the activation maps of forepaw and hindpaw corresponding to the ROI shown in (A).

