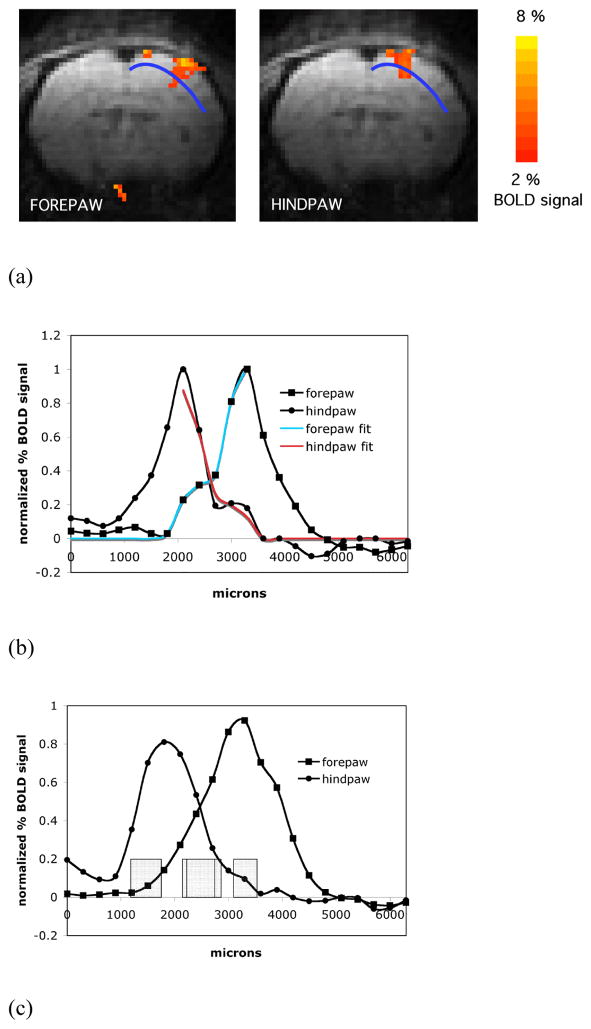
Fig. 5.
(A) Representative averaged activation maps of forepaw and hindpaw overlaid upon averaged anatomical images are shown in coronal orientation. (B) Normalized BOLD signal profiles of the forepaw and hindpaw representations and their fit curves corresponding to the same ROI shown in (A). The profiles and their fit curves exhibit a significant overlap between the representations. (C) Normalized BOLD signal profiles of forepaw and hindpaw averaged for five animals and the averaged zeromajor and zerominor points of the abscissa cross-section (mean ± SD, grey boxes).

