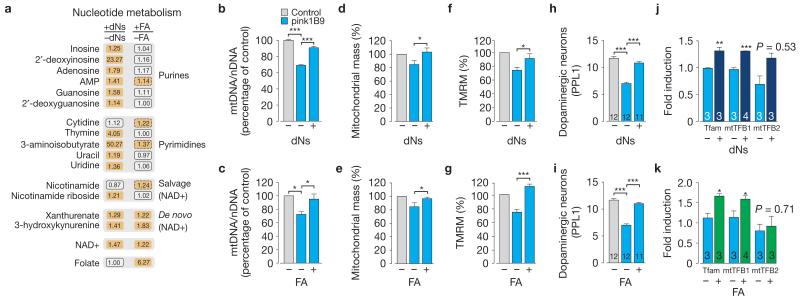
Figure 6. Dietary supplementation with dNs or FA enhances mitochondrial function and biogenesis in pink1 mutants.
(a) Dietary supplementation with dNs (0.5 mg ml−1 each dN) or FA (4 mM) promotes an upregulation of biochemical components of nucleotide metabolism pathways in pink1 mutants. Orange corresponds to metabolites that are upregulated to a significant level (P <0.05). Orange oblongs with a dashed outline correspond to comparisons with lower statistical significance (0.05 < P < 0.10). Statistical significance was determined using Welch’s two-sample t-test (n = 5). See also Supplementary Table 7. (b,c) Dietary supplementation with dNs (b) or FA (c) during the adult stage promotes an increase in mtDNA. The ratio of mtDNA to nDNA was measured by real-time PCR using 2-day-old flies with the indicated genotypes (mean±s.d. n = 9 (b), n = 3 (c) per genotype). Statistically significant values are indicated by asterisks (one-way ANOVA with Bonferroni’s multiple comparison test). (d,e) dNs or FA promote an increase in neuronal mitochondrial mass of pink1 mutants. Data are shown as the mean±s.e.m. (n = 6 for dNs, n = 7 for FA). Statistical significance is indicated by asterisks (two-tailed paired t-test). Data sets labelled control and pink1B9 are also used in Fig. 5c (f,g) dNs or FA reverse the loss of ΔΨm in pink1 mutants. The ΔΨm is represented as percentage of control. The error bars represent the mean±s.e.m. (n = 7). Statistical significance is indicated by asterisks (two-tailed unpaired t-test). Data sets labelled control and pink1B9 are also used in Fig. 5d. (h,i) dNs or FA reverse the loss of dopaminergic neurons in the PPL1 cluster of pink1 mutants. Data are shown as the mean±s.e.m. (n values are indicated in the bars; asterisks, one-way ANOVA with Bonferroni’s multiple comparison test). Data sets labelled control and pink1B9 are also used in Fig. 5b. (j,k) dNs or FA promote the transcriptional upregulation of the nuclear-encoded mtDNA-binding proteins Tfam, mtTFB1 and mtTFB2 in pink1 mutants. The error bars represent s.e.m. values (n values are indicated in the bars), and the asterisks indicate statistically significant values (two-tailed unpaired t-test) relative to pink1 flies on a normal diet. See also Supplementary Fig. 6 and Table 9 for statistics source data of c,j and k.

