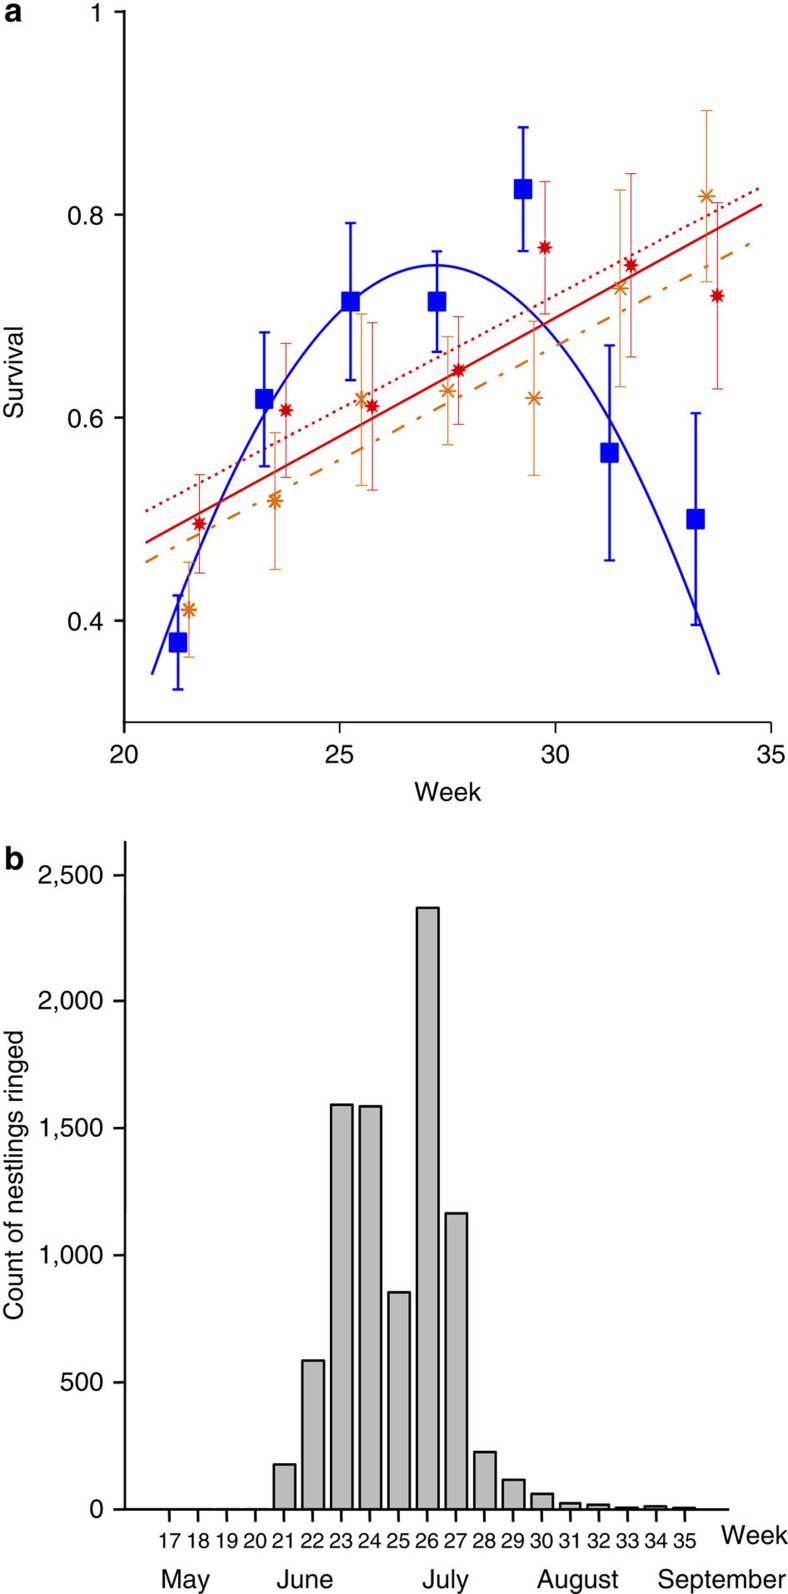
Figure 1. Seasonal changes of survival of larvae and emergence of juvenile birds.
(a) Mean observed survival of three artificial larval types (N=1171, ±s.e.m.) over the season (non-warning-coloured: blue squares, small signals: orange stars, large signals: red bold stars) and the predictions for two best models (models D and E). The seasonal relationship for non-warning-coloured prey (blue curve) is identical in both models but differ for warning-coloured prey. Model D predicts an identical increase for small and large signals (red solid line) and model E a higher survival for large signals (red dotted line) than for small signals (orange line). (b) The estimated nest-leaving dates of juvenile passerine birds in Finland.

