Figure 3.

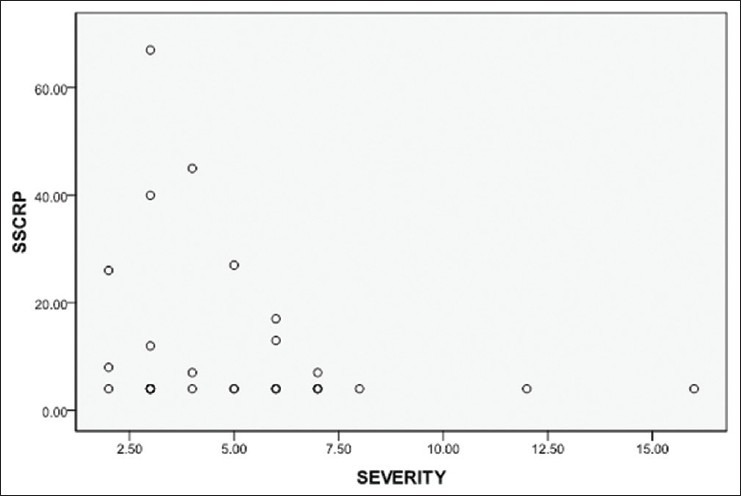
Scatter plot for correlation between C-reactive protein and severity score in asymptomatic steady state hemoglobin SS group (P = 0.17)

Scatter plot for correlation between C-reactive protein and severity score in asymptomatic steady state hemoglobin SS group (P = 0.17)