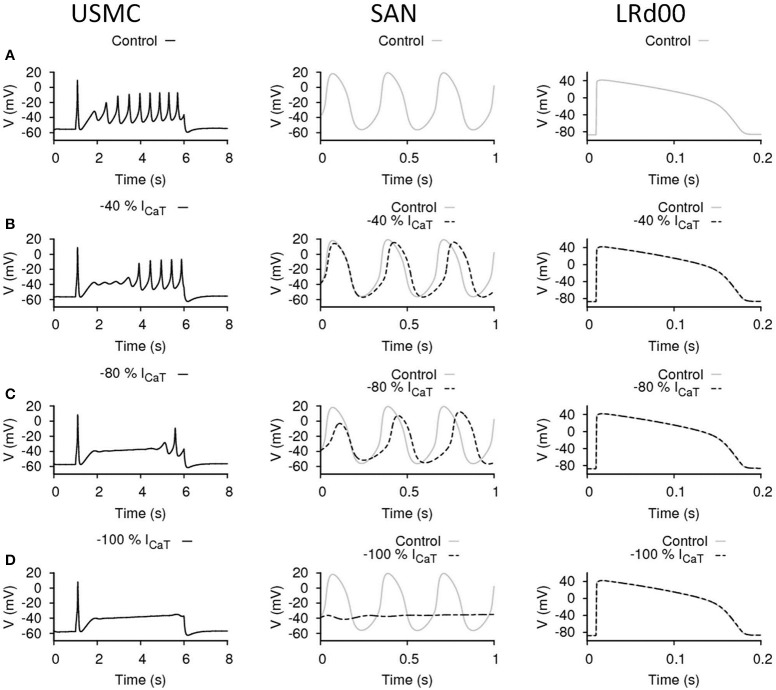
Figure 4.
Effects of reducing ICaT in uterine and cardiac cells. Effects on the action potential forms and characteristics with reduced ICaT in different cell types: the USMC cell model (left), the SAN cell model (center), and the LRd00 ventricular cell model (right). (A) Control configuration at full ICaT and the effects of reducing ICaT by: (B) 40%, (C) 80%, and (D) 100%. The negative sign indicated reduction.

