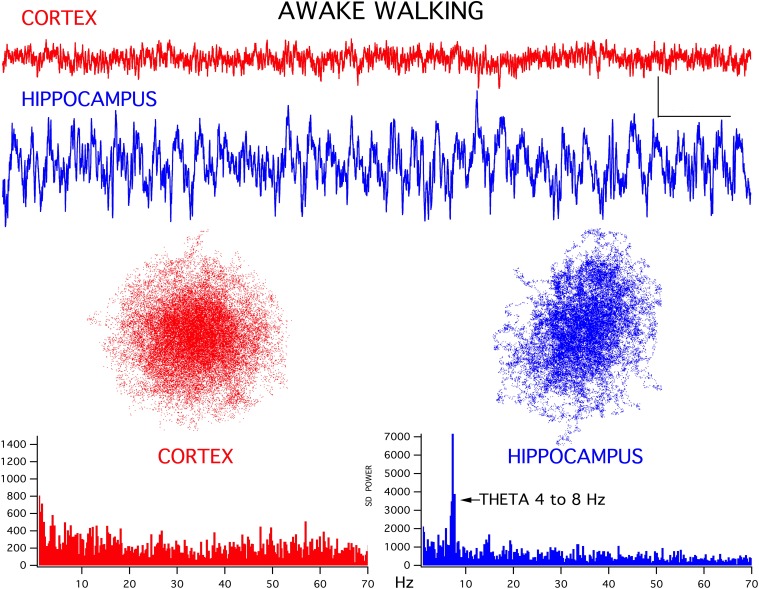
Figure 1.
Representative EEG recordings of frontal cortex (CORTEX) and hippocampal CA1 (HIPPOCAMPUS) signals for simultaneously recorded activity. During walking/exploring behavior, low amplitude fast activity is seen in cortex and a theta rhythm is generated in hippocampus. Chaotic attractor plots and FFT magnitude graphs, for these two records are shown below the recordings. Calibration bars = 200 μV and 500 ms. Note that the gain of the hippocampal signal was reduced by 1/3 for the analyses, to maintain scaling with respect to cortex.

