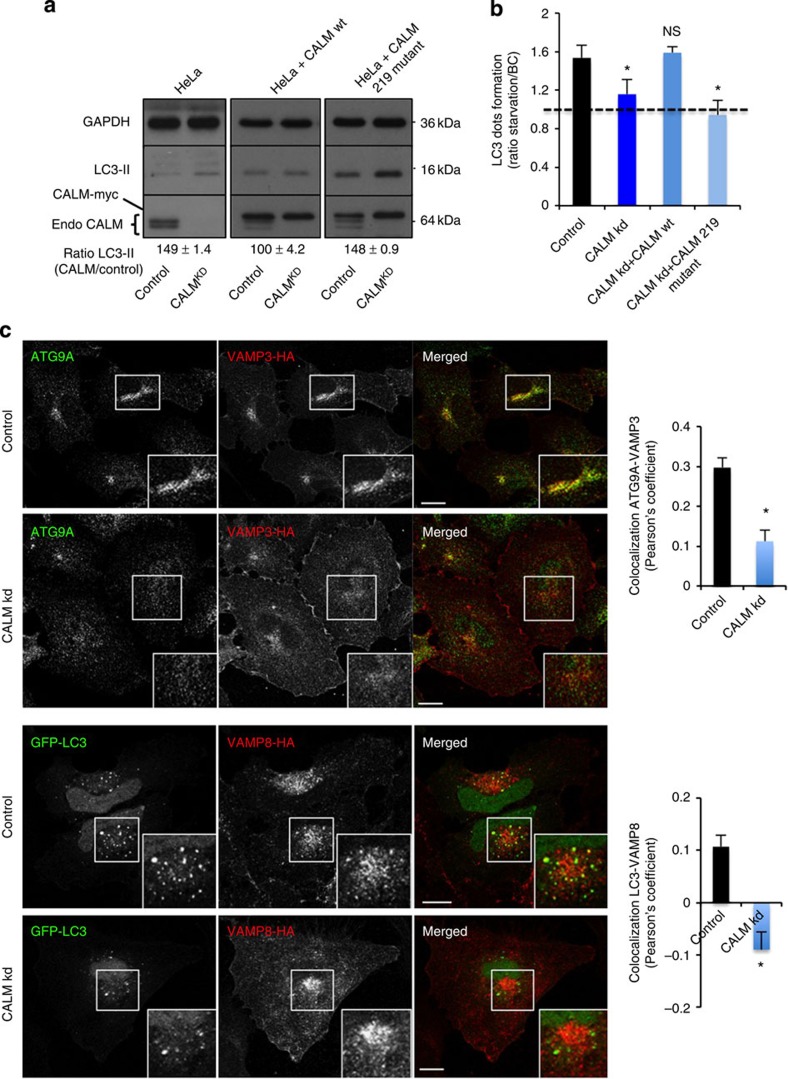
Figure 4. CALM affects autophagy via SNARE endocytosis.
(a) LC3 levels in CALM knockdown cells. CALM was knocked down in cells expressing or not expressing an siRNA-resistant form of CALM wild type (wt) or CALM 219 mutant, as indicated. The cells were lysed and subjected to western blotting. The knockdown efficiency, LC3-II levels and the level of the siRNA-resistant form of CALM are shown on the western blotting. (b) LC3 dots counting in CALM knockdown cells. CALM was knocked down in cells expressing GFP-LC3 with or without an siRNA-resistant form of CALM wild type (wt) or CALM mutant (219 mutant) as indicated. The cells were kept in full medium or starved in Hanks balanced salt solution (HBSS) for 4 h, fixed and subjected to microscopy to score the number of LC3 dots per cell. The ratio of the number of LC3 dots per cell (shown as mean ±s.d.) between starvation and basal conditions is shown on the graph (*P<0.01; NS, not significant, two-tailed t-test; n≥300 cells per condition; BC, basal conditions). (c) Co-localization between ATG9A and VAMP3-HA or GFP-LC3 and VAMP8-HA in control and CALM knockdown HeLa cells stably expressing VAMP3-HA or VAMP8-HA. Confocal pictures are shown with magnified areas showing co-localization between ATG9A and VAMP3 or GFP-LC3 and VAMP8 in control cells and no co-localization in CALM knockdown cells. Quantification of ATG9A-VAMP3 or GFP-LC3-VAMP8 co-localization is shown on the graph as a Pearson’s coefficient (data are mean ±s.d.; *P<0.05; two-tailed t-test). Scale bars, 5 μm.

