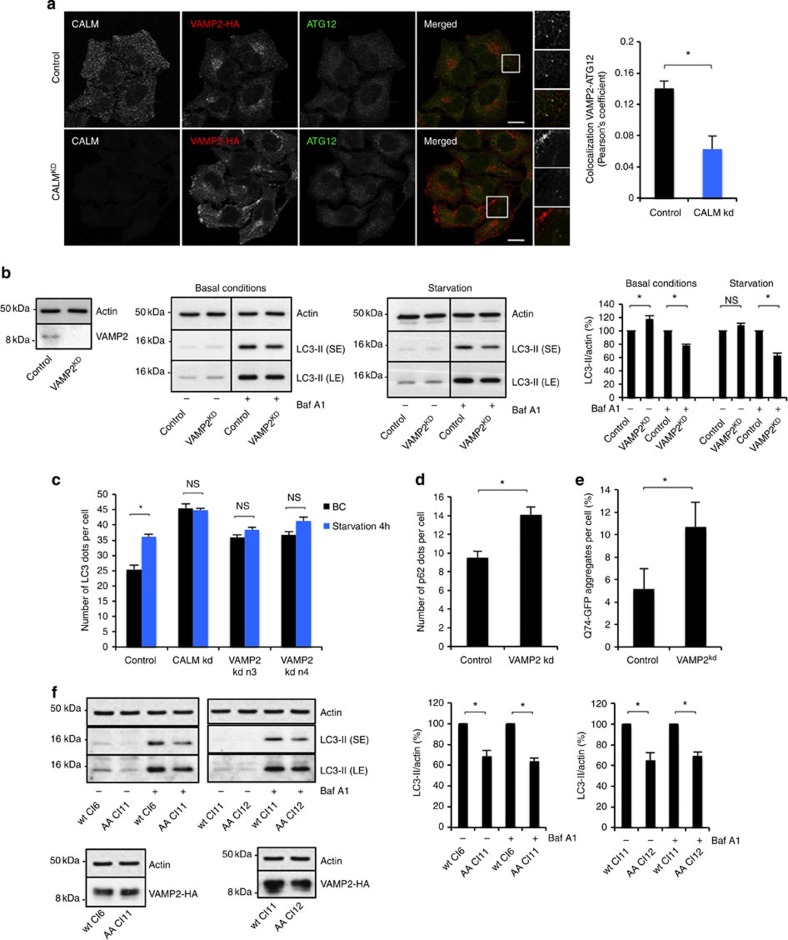
Figure 5. VAMP2 regulates autophagosome formation.
(a) Co-localization between ATG12 and VAMP2-HA in control and CALM knockdown HeLa cells stably expressing VAMP2-HA. Confocal pictures are shown with magnified areas on the right showing co-localization between ATG12 and VAMP2 in control cells and no co-localization in CALM knockdown cells. Quantification of ATG12-VAMP2 co-localization is shown on the graph as the Pearson’s coefficient (data are mean ±s.d.;*P<0.05; two-tailed t-test). Scale bars, 5 μm. (b) Western blot analysis of VAMP2, actin and LC3-II in HeLa cells where VAMP2 was knocked down, as indicated. The cells were starved in Hanks balanced salt solution (HBSS) and treated with Baf A1 as indicated. (SE, short exposure; LE, longer exposure.) Quantification of LC3-II/actin ratio is shown. Data are representative of three independent experiments and shown as mean ±s.d. (*P<0.05; NS, not significant, two-tailed t-test). (c) LC3 dot counting in CALM and VAMP2 knockdown cells. CALM or VAMP2 were knocked down in cells expressing GFP-LC3. The cells were kept in full medium or starved in HBSS for 4 h, fixed and subjected to automated fluorescence microscopy to score the number of LC3 dots per cell. The number of LC3 dots per cell (shown as mean ±s.d.) is shown on the graph for each condition (n≥300 cells per condition; BC, basal conditions). (*P<0.01; NS, not significant, two-tailed t-test). (d) Number of p62 dots per cell in VAMP2 knockdown. HeLa cells where VAMP2 was knocked down were fixed and subjected to microscopy after labelling endogenous p62 using specific antibody. The data represent the number of p62 dots per cell shown as mean ±s.d. (*P<0.05; two-tailed t-test; n≥300 cells per condition). (e) Percentage of Q74-expressing cells with aggregates in VAMP2 knockdown HeLa cells. Data are from one representative experiments performed in triplicate, out of three independent experiments and shown as mean ±s.d. (*P<0.05; two-tailed t-test). (f) Western blot analysis of VAMP2, actin and LC3-II in HeLa cells stably expressing VAMP2-HA wild type or VAMP-2-HA mutated in the CALM-binding site at different levels (wild-type clone 6, wt Cl6: low level; wild-type clone 11, wt Cl11: high level; mutant clone 11, AA Cl11: low level; mutant clone 12, AA Cl12: high level). The cells were treated with Baf A1 as indicated. (SE, short exposure; LE, longer exposure). Quantification of LC3-II/actin ratio is shown. Data are representative of three independent experiments and shown as mean ±s.d. (*P<0.05; two-tailed t-test).

