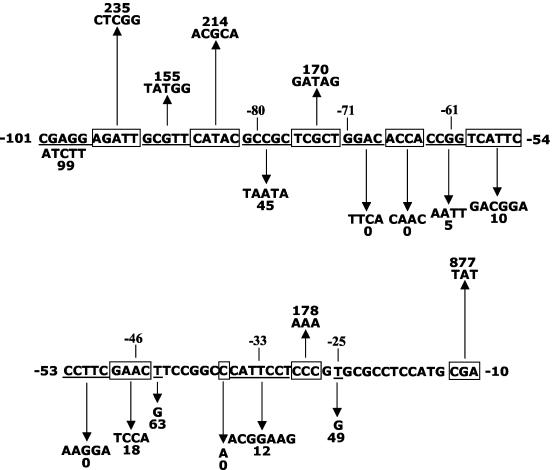
FIG. 4.
Summary of the effects of mutations in the Ω4499 promoter region. DNA subjected to mutagenesis is alternately underlined and boxed. Upward and downward arrows indicate that developmental lacZ expression was increased or decreased, respectively, by the given change in DNA sequence, and numbers indicate the maximum β-galactosidase specific activity observed for the mutant, expressed as a percentage of wild-type promoter activity measured in the same experiment (Table 2).

