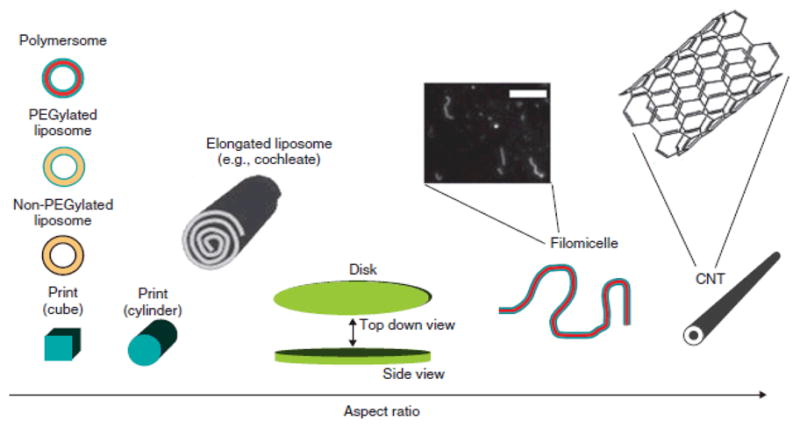
Figure 2. Carrier geometries.

Schematics of different geometry carriers are shown in order of increase of their aspect ratio. Blue and red colors indicate PEG coating and hydrophobic polymer, respectively. Thick black lines in liposomes represent polar groups of phospholipids, while yellow indicates non-polar tails. Blown up fluorescence microscopy image of labeled filomicelles is shown. Scale bar is 10 μm. Common chemical structure is shown in blow up of carbon nano-tubes, CNT (5,5-armchair conformation for a non-spiraled SWNT). For further explanations, see E. Simone et al, 2008 (Reproduced with permission from Simone at al, 2008).
