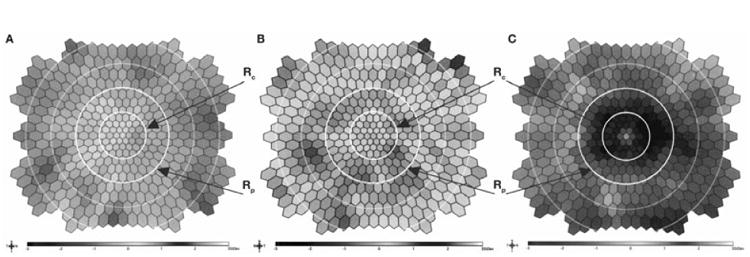
Figure 1.

Color difference plots of (A) reference control, (B) HCQ-nontoxic, and (C) HCQ-toxic subjects. These consist of two dimensional displays of hexagons interpolated from the 103 hexagon test stimulus. Differences between patient value and age-adjusted normal value corresponding to each hexagon are color-coded, such that blue or black hexagons indicate patient value reductions that exceed 2 standard deviations from normal. Central (Rc) and pericentral (Rp) regions are outlined by white concentric circles.
