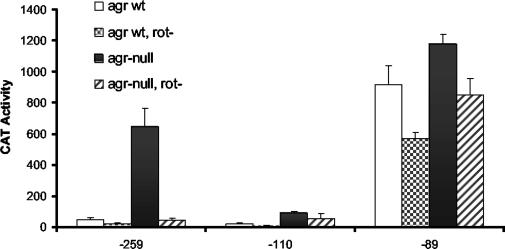
FIG. 8.
Effect of Rot on spa promoter activities. The x axis indicates the upstream boundary of the promoter fragments. Host strains were agr+ (white bars), agr+/rot-negative (stippled bars), agr-null (black bars), and agr-null/rot-negative (hatched bars). Samples were from postexponential-phase culture lysates. CAT activity is expressed as nanomoles of chloramphenicol acetylated per minute per milligram of cells (dry weight). Values plotted are the means of at least three determinations with the standard deviations.

