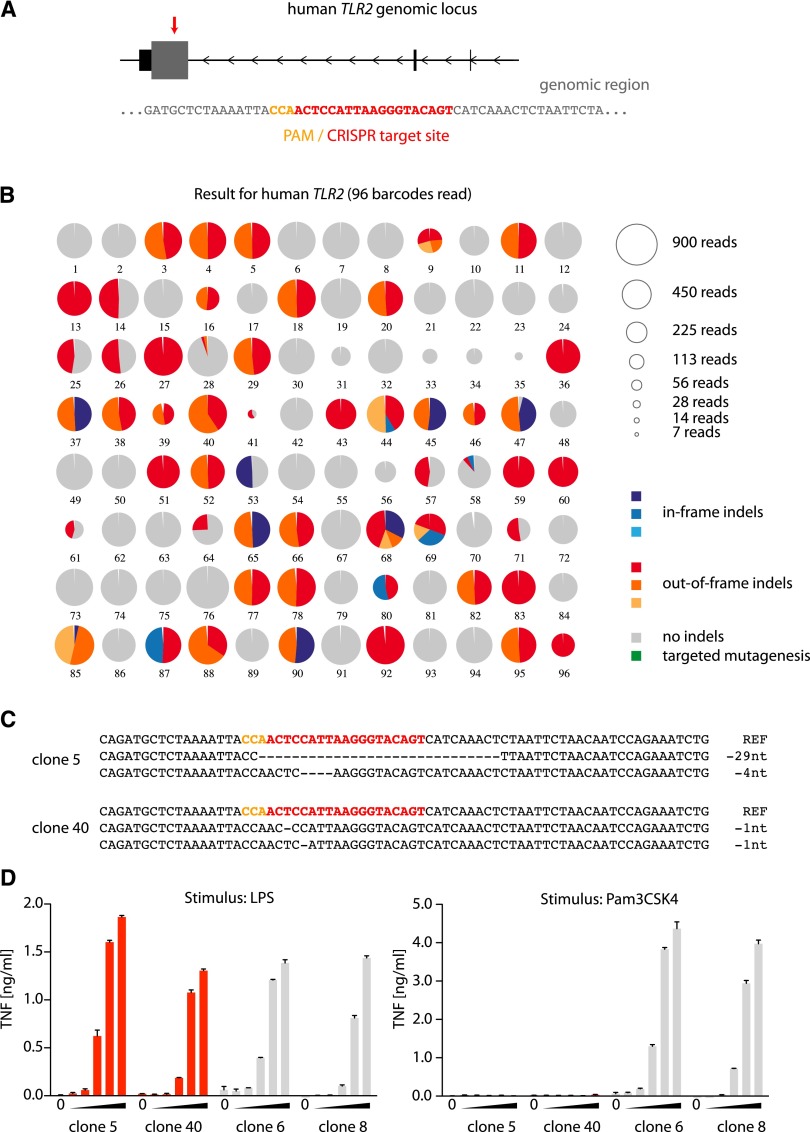
Figure 2.
Application of the OutKnocker analysis tool to generate TLR2 knockout THP-1 cells. (A) The genomic locus of the human TLR2 gene is depicted. Small, black square represents noncoding exons, whereas the large, gray square represents coding exons. The red arrow highlights the target site of the CRISPR that is magnified below. (B) Shown is the analysis performed by OutKnocker of 96 THP-1 clones that were treated with a CRISPR targeting human TLR2. Every pie chart represents a clone, whereas the size of each chart corresponds to the number of reads that were analyzed to evaluate the clone (see legend in the top right). Colors of the individual pie areas indicate in-frame mutations (blue), out-of-frame mutations (red), or no indel calls (gray) (see legend in the bottom right). (C) The identified indel mutations of two knockout clones (5 and 40) are depicted. Orange letters highlight the PAM sequence and red letters indicate the CRISPR target site. (D) Two knockout clones (clones 5 and 40) as well as two unmodified clones (clones 6 and 8) were stimulated with increasing amounts of either the TLR4 ligand LPS (serial dilutions 1:10 from 1 µg/mL to 0.1 ng/mL) or with the TLR2 ligand Pam3CSK4 (serial dilutions 1:10 from 1 µg/mL to 0.1 ng/mL). A representative result out of two independent experiments is depicted as mean value + SEM of biological duplicates.

