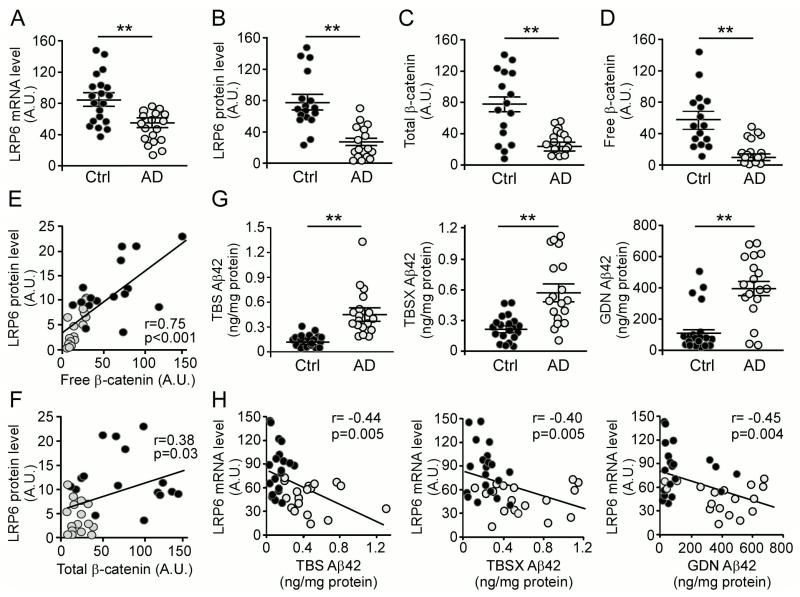
Figure 6. Decreased LRP6 and Wnt Signaling in Human AD Brains.
(A) LRP6 mRNA levels in human control (n=20) and AD (n=18) brain tissues quantified by real-time PCR. Results are normalized to β-actin levels and presented in relative units. In the following figures, data are shown as scatterplots in which each symbol represents an individual case. A.U., arbitrary unit. Data represent mean ± SEM. **p < 0.01.
(B) LRP6 protein levels in human control (n=17) and AD (n=17) brain tissues quantified by Western blot analysis. Data represent mean ± SEM. **p < 0.01.
(C and D) The total and free β-catenin levels in human control (n=16) and AD (n=16) brain tissues examined by Western blot analysis. Free β-catenin levels were analyzed by GST-E-Cadherin pull-down assay. Data represent mean ± SEM. **p < 0.01.
(E) Correlation between LRP6 protein levels and free β-catenin levels in human control (dark circles) and AD (light circles) brain tissues (r represents the correlation coefficient; p is significance).
(F) Correlation between LRP6 protein levels and total β-catenin levels in human control (dark circles) and AD (light circles) brain tissues.
(G) Aβ42 levels in TBS, TBSX, and GDN fractions of human control (n=20) and AD (n=18) brain tissues. Data represent mean ± SEM. **p < 0.01.
(H) Correlation between LRP6 mRNA levels in (A) and those of Aβ42 in various extraction fractions (TBS, TBSX or GDN) in (G) in human control (dark circles) and AD (light circles) brain tissues.

