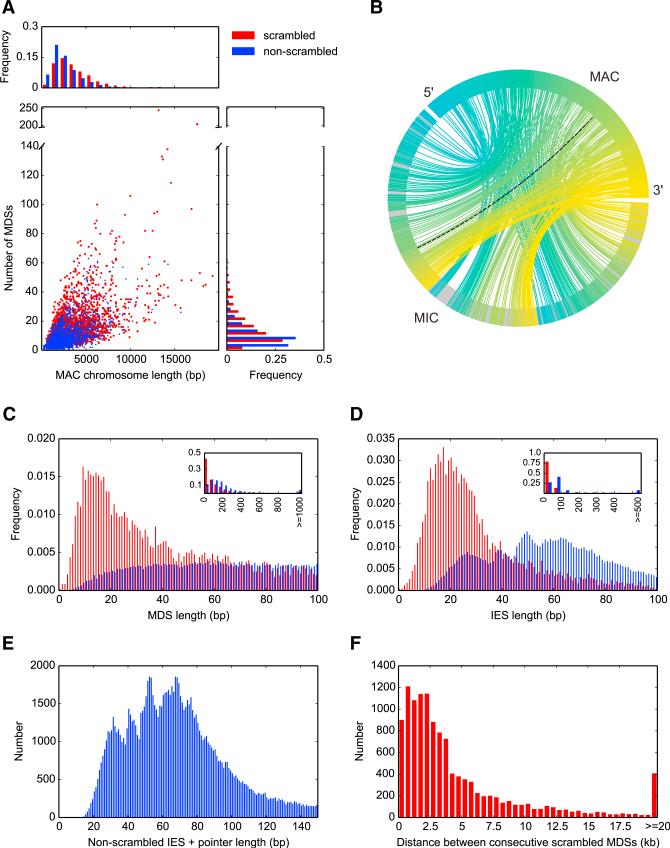
Figure 2. The MIC Genome Is Fragmented into Hundreds of Thousands of Segments with Massive Levels of Scrambling.
(A) Comparison of chromosome length and number of MDS segments between 13,910 non-scrambled (blue) and 2,310 scrambled nanochromosomes (red) completely covered on single MIC contigs.
(B) A chord diagram mapping MIC ctg7180000068801 to its rearranged form, MAC Contig17454.0. Lines connect precursor (MIC) and product (MAC) MDS locations; black dotted line, an inverted MDS; all 245 MDSs (242 are scrambled) drawn in a blue to yellow MAC color gradient; IESs, gray.
(C) Length distribution of 44,191 nonscrambled and 9,841 scrambled MDSs <100 nt (excluding pointers). Inset: 150,615 nonscrambled MDSs and 16,350 scrambled MDSs excluding pointers, showing the most typical length of scrambled MDSs is <50 nt.
(D) Length distribution of 101,345 nonscrambled and 8,333 scrambled high-confidence IESs <100 nt (excluding pointers and IESs that contain other MDSs). Inset: 147,122 nonscrambled versus 9,040 scrambled IESs excluding pointers and IESs that contain other MDSs. We identified six strong cases of 0 bp MDSs (four nonscrambled [Contig7827.0 MDS3, Contig11190.0.1 MDS18, Contig13633.0 MDS3, and Contig9208.0.0 MDS18] and two scrambled [Contig6325.0.0 MDS58 and Contig1267.1 MDS7]).
(E) Length distribution of 112,125 nonscrambled IESs (excluding those that contain other MDSs) <150 nt, with one copy of the pointer included (i.e., the total length of DNA deleted).
(F) MIC genomic distance between scrambled MDSs that are consecutive in the MAC (n = 12,197); distance calculated from the pointer flanking MDS N to its paired pointer flanking MDS N+1.
See also Figure S2.

