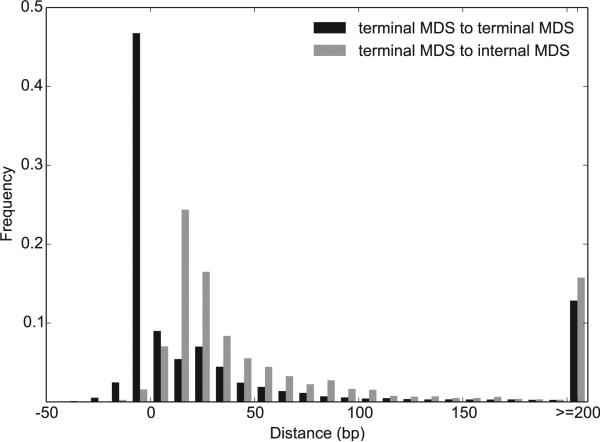
Figure 4. The Distance between Adjacent Terminal MDSs Is Much Smaller Than that between Terminal MDSs and Adjacent Internal MDSs for a Different MAC Chromosome.
Negative values represent the length of overlapping regions, with the peak distance between terminal MDSs from −1 to −10 bp (10,006 pairs, black) and the peak between terminal MDS to internal MDS between 10–19 bp (2,863 pairs, gray).
See also Figure S3.

