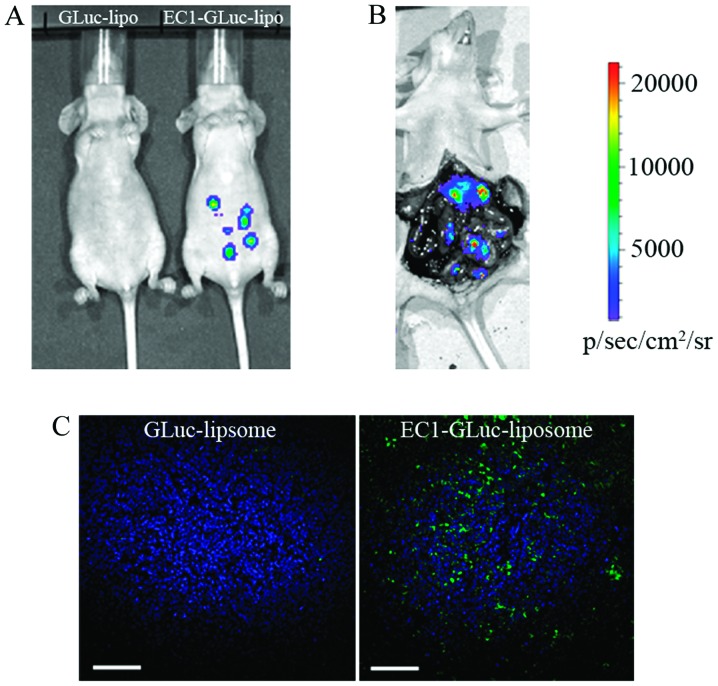
Figure 6.
Bioluminescence imaging and delivery of HPTS into metastatic SKOv3 tumors by EC1-Gaussia luciferase (GLuc)-liposome. (A) Bioluminescence imaging of metastatic SKOv3 tumor-bearing mice. A GLuc-liposome-treated mouse is shown on the left. AEC1-GLuc-liposome-treated mouse is shown on the right. (B) Bioluminescence imaging of metastatic SKOv3 tumor-bearing mice after laparotomy. The color scale represents p/sec/cm2/steradian. (C) Delivery of HPTS into metastatic ovarian tumors by the EC1-GLuc-liposome. Green represents the fluorescence of HPTS delivered into the tumor, and blue represents the nuclear staining with Hoechst 33248. The image on the left is from a tumor section treated with the GLuc-liposome, and the one on the right is from a tumor section treated with the EC1-GLuc-liposome. Scale bars, 100 μm.

