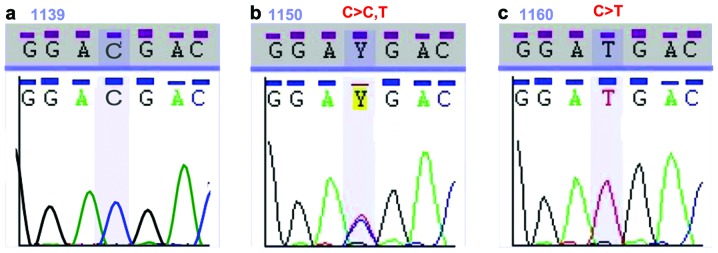
Figure 1.

Chromatogram of DNA sequences for exon 1. The rectangles indicate the sites where the single nucleotide polymorphism (SNP) rs1957106 was located. (a) Non-cancerous brain tissue sample, representing the SNP rs1957106 CC genotype. (b) Glioblastoma sample, representing the rs1957106 CT genotype. (c) Glioblastoma sample, representing the SNP rs1957106 TT genotype.
