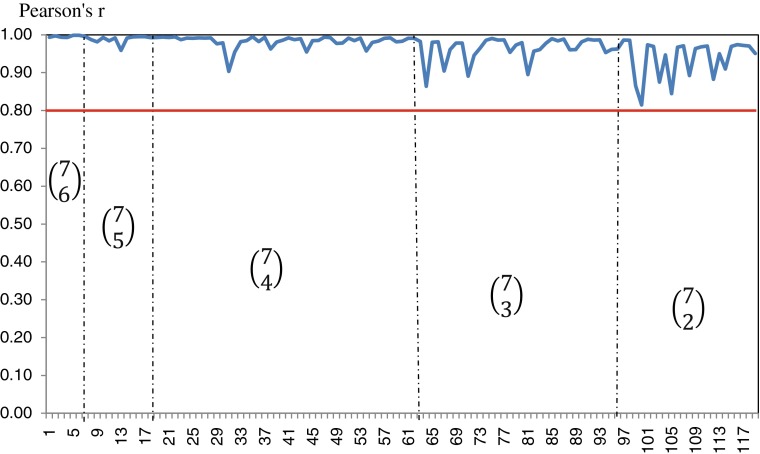
FIG. 5.
Pearson correlation coefficient for UHI with subset of 6, 5, 4, 3, and 2 indicators (N = 119). As described in the text, each section represents the UHI with one or more component indicators removed. For example, in the first vertical section, we recalculate the UHI with 6 or the 7 indicators, for all possible combinations of 6 (N =  = 7!/(6! × 1!) = 7 combinations. The correlation of each these points with the original URI is approximately 0, 99. The correlations become smaller as an increasing number of indicators are removed, but remains above 0.9 until more than three are removed.

