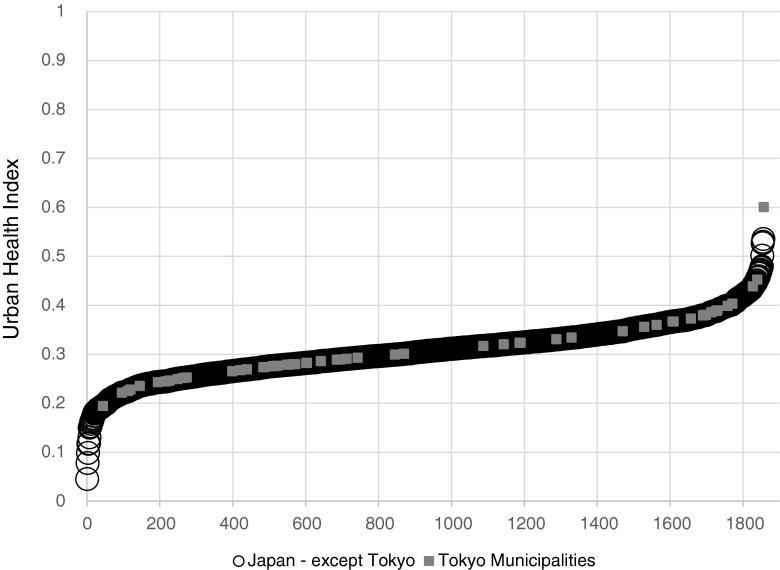
FIG. 6.
Distribution the UHI for all municipalities in Japan, with the values for municipalities in Tokyo prefecture superimposed. The graph depicts the distribution of the UHI using the minimum value for the data set, adjusted to prevent zeros in the numerator of the contributing indicators (see text). The graph for the UHI using zero as the minimum is virtually identical.

