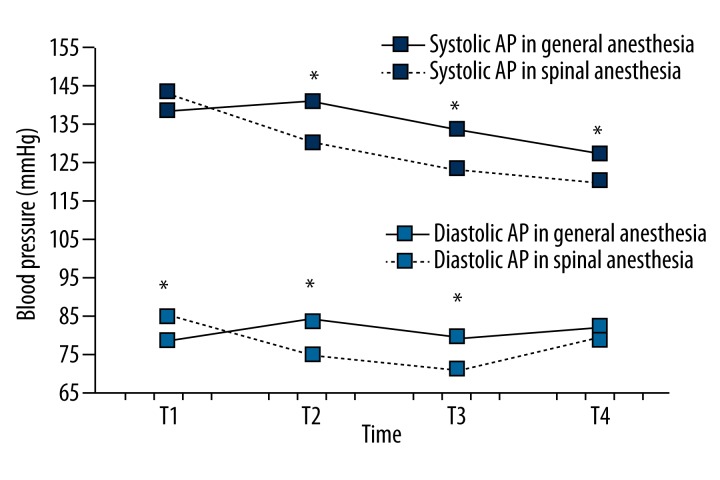
Figure 3.
Comparison of systolic and diastolic AP between the groups during the observed period. Systolic AP was significantly higher in the general anesthesia group at times T2, T3 and T4 (p<0.05), while the difference was not statistically significant at time T1 (p=0.303). Diastolic AP in the general anesthesia group was significantly lower at time T1, while at times T2 and T3 diastolic AP is significantly higher compared to the spinal anesthesia group (both p<0.01). The difference in diastolic AP measurements was not statistically significant at time T4 (p=0.246). Changes in values of systolic and diastolic AP are statistically significant in the observed time for both groups (p<0.01). (* p<0.01 or p<0.05).

