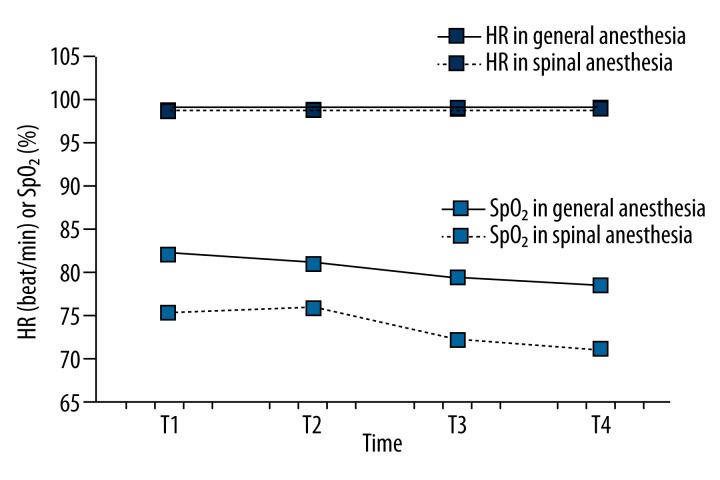
Figure 4.
Comparison of the HR and SpO2 values between groups during the observed period. During the observed period the HR is significantly different (p<0.01) with a significant linear trend of depreciation of the HR (p<0.01) but there was no significant difference in the fluctuations of the values at different points of measurement (p=0.917). Changes in HR do not vary significantly over time for both group (p=0.456). SpO2 values do not differ significantly between the groups (p=0.081) or in the observed period (p=0.475).

