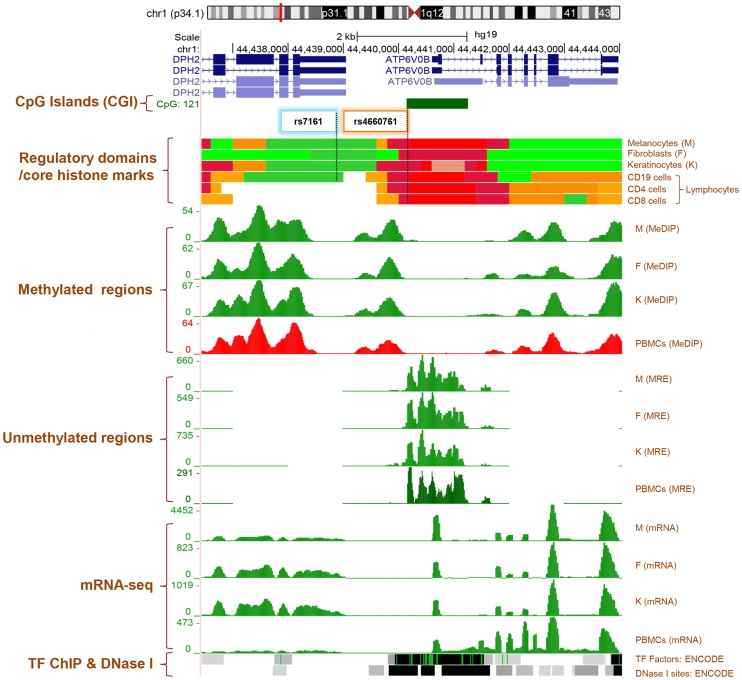
Figure 1. Genome Browser (http://genome.ucsc.edu/) image of ATPV0B and DPH2 gene regions on human assembly hg19 based on NIH Epigenomics Roadmap data and ENCODE data [74], [76].
The promoter CpG islands (CGIs) of ATPV0B (CGI: 121) is highlighted by a green filled box. Regulatory domains (chromatin state segmentation using a hidden Markov Model [ChromHMM)] and core histone marks: Crimson, flanking TSS; Red, active transcriptional start site (TSS); Dark Green: transcription elongation/transition; Yellow green: transcription enhancer-like; Orange, active-to-weak enhancer. MeDIP: methylated DNA immunoprecipitation, MRE: methylation-sensitive restriction enzyme sequencing, Melanocytes: normal primary penile foreskin melanocytes (UCSF-UBC-USC and UCSF-UBC), Fibroblasts: normal primary penile foreskin fibroblasts (UCSF-UBC-USC and UCSF-UBC), Keratinocytes: normal primary penile foreskin keratinocytes (UCSF-UBC-USC and UCSF-UBC), PBMCs: peripheral blood mononuclear cells (UCSF-UBC-UCD and UCSF UBC), and Lymphocytes:CD19, CD4 and CD8 cells (NIH Epigenomics Roadmap data). TF: transcription factors ChIP-seq (161 factors) from ENCODE with Factorbook Motifs. DNase I: Open chromatin DNase I hypersensitivity clusters in 125 cell types from ENCODE. SNPs rs4660761 and rs7161 are highlighted by colored boxes. Sources and acknowledgements for the UCSC genome, ENCODE, The NIH ROADMAP databases and extracted tracks http://genome.ucsc.edu/goldenPath/credits.html#human_credits.

