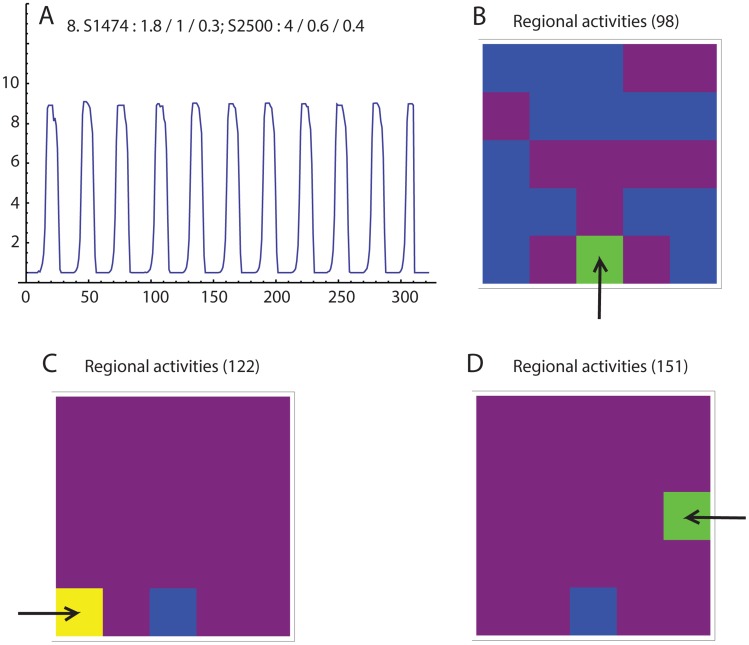
Figure 5. A. Simulation using the same seed values as in figure 4 , and midrange parameter values.
The periods between contractions varies only slightly. B, C, and D. Regional activities immediately prior to the 4th, 5th, and 6th contractions, respectively. Each of the three contractions has a different apparent pacemaker (arrow).

