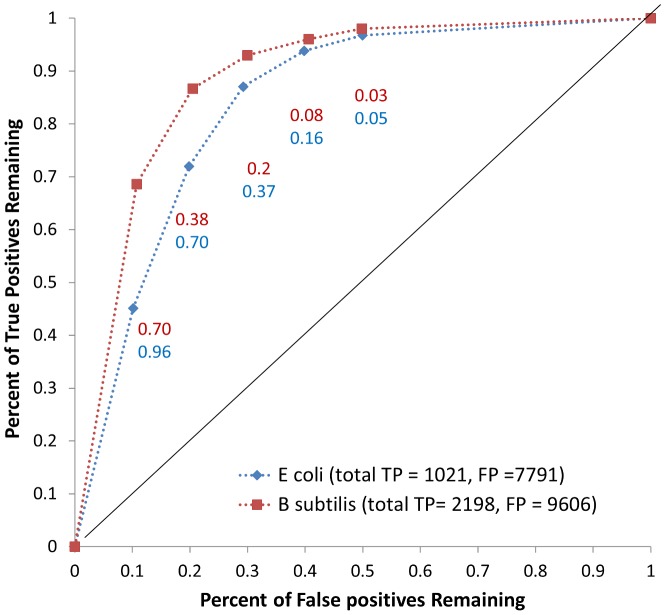
Figure 2. ROC curve for annotations.
We computed the likelihood of all possible gene-reaction pairings from the ModelSEED database and compared the likelihoods of those pairings present in the iJR904 E. coli and iBSU1103 B. subtilis models (‘true positives’) to those which were not (‘false positives’). Each point in the curve represents the percentage of true and false positive linkages remaining at different likelihood cutoffs (labeled on each point). We found that there was a significant enrichment of true positives at high likelihood levels and false positives at low likelihood levels.

