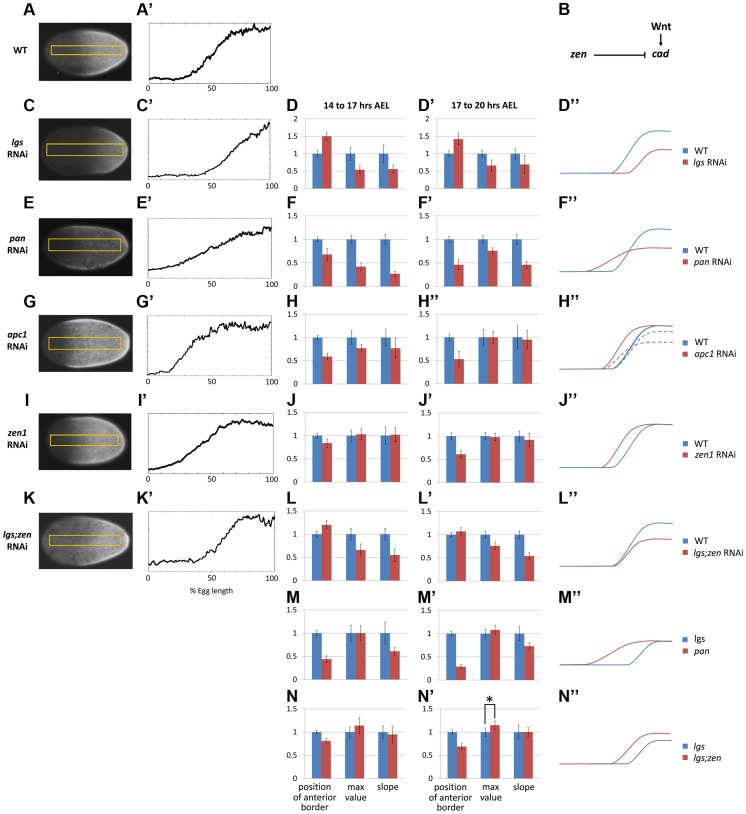
Figure 2. Characterization of Tc-cad gradient in WT and RNAi knockdowns.
(A, A′) Tc-cad gradient in WT. (B) A model for Tc-cad regulation in the Tribolium blastoderm. (C–D″) Tc-cad gradient expression in a Tc-lgs RNAi embryo (C, C′), and the average of its three descriptors normalized to WT values (Text S3) in 14–17 AEL (D) and 17–20 AEL (D′). As inferred from (D, D′), a comparison between the spatial distribution of Tc-cad gradient in Tc-lgs RNAi embryos and that of WT is summarized in D″ (not to scale). The same was performed for Tc-pan (E–F″), Tc-apc1 (G–H″; in H″: dashed curve for 14–17 AEL and solid curve for 17–20 AEL), Tc-zen1 (I–J″), and Tc-lgs;Tc-zen1 (K–L″) RNAi embryos. (M–M″) the average of the three descriptors of the Tc-cad expression gradient in Tc-pan RNAi normalized to Tc-lgs RNAi values (Text S3). (N–N″) the average of the three descriptors of the Tc-cad expression gradient in Tc-lgs;Tc-zen1 RNAi normalized to Tc-lgs RNAi values. Anterior to the left. Error bars represent 95% confidence intervals. Asterisk (*) represents p-value<0.05.

