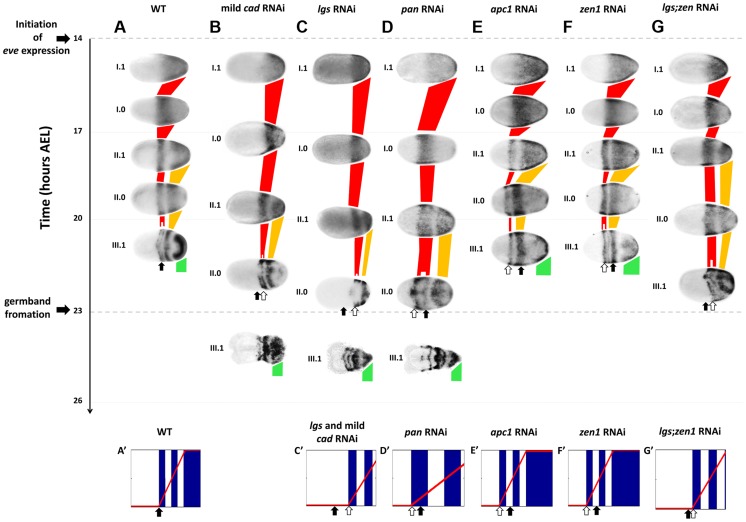
Figure 3. Tc-eve expression in WT and RNAi knockdowns.
Tc-eve expression waves in WT (A), mild Tc-cad (B), Tc-lgs (C), Tc-pan (D), Tc-apc1 (E), Tc-zen1 (F) and Tc-lgs;Tc-zen1 (G) RNAi embryos (First cycle/wave/stripe in red, second in gold, and third in green). Tc-eve expression patterns were classified according to the cycle of Tc-eve oscillation in the posterior end of the embryo (roman numerals) and the phase of the cycle (1 for high phase, and 0 for low; e.g. I.1: high phase of the first cycle). Embryos were mapped on the time axis according to timing data (see text). Arrows indicate the position of the anterior border of Tc-eve expression at 20–23 hours AEL in WT (black arrow) and in different knockdowns (white arrows). Shown also are snapshots of computer simulations of a Tc-eve oscillator the frequency of which is modulated by the Tc-cad gradient of WT (A′; see Movie S1, upper panel), mild Tc-cad and Tc-lgs RNAi (C′; see Movie S2, lower panel), Tc-pan RNAi (D′; see Movie S3, lower panel), Tc-apc1 (E′; see Movie S4, lower panel), Tc-zen1 (F′; see Movie S5, lower panel), and Tc-lgs;Tc-zen1 (G′; see Movie S6, lower panel) RNAi embryos; blue: Tc-eve expression, red curve: Tc-cad expression gradient. Snapshots were taken at the end of the corresponding simulations. Anterior to the left. Simulations were performed using Matlab (code is available in Text S1).

