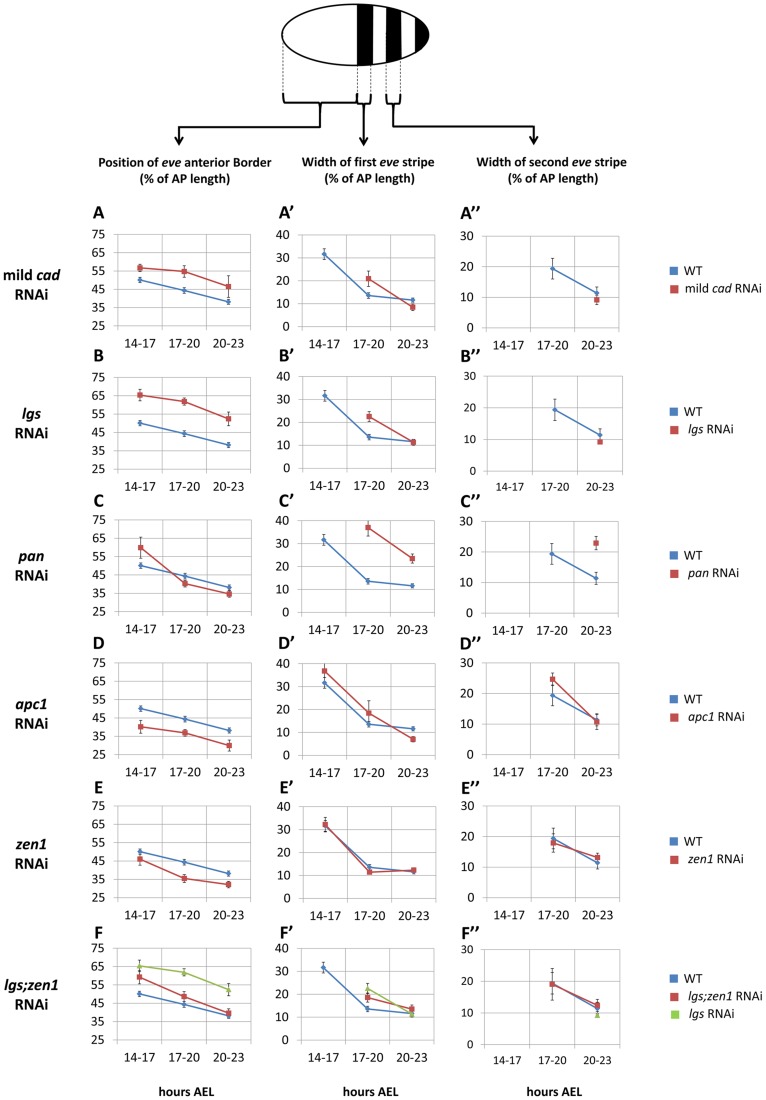
Figure 4. Spatial characteristics of Tc-eve waves over time in WT and RNAi knockdowns.
(A, B, C, D, E, F) average position of the anterior border of Tc-eve expression over time in mild Tc-cad (A), Tc-lgs (B), Tc-pan (C), Tc-apc1 (D), Tc-zen1 (E) and Tc-lgs;Tc-zen1 (F) RNAi embryos (red) compared to WT (blue; along with Tc-lgs RNAi in case of Tc-lgs;Tc-zen1, green). Same comparisons were performed for average width of first (A′, B′, C′, D′, E′, F′) and second (A″, B″, C″, D″, E″, F″) Tc-eve stripes. At top is a depiction of Tc-eve expression (black stripes) in a WT Tribolium embryo at late blastoderm stage; anterior to the left. All measurements were normalized to AP axis lengths (Text S3 and Figure S5). A missing data point for a certain stripe indicates that stripe has not formed yet; a stripe proper should have both anterior and posterior borders. Error bars represent 95% confidence intervals.

