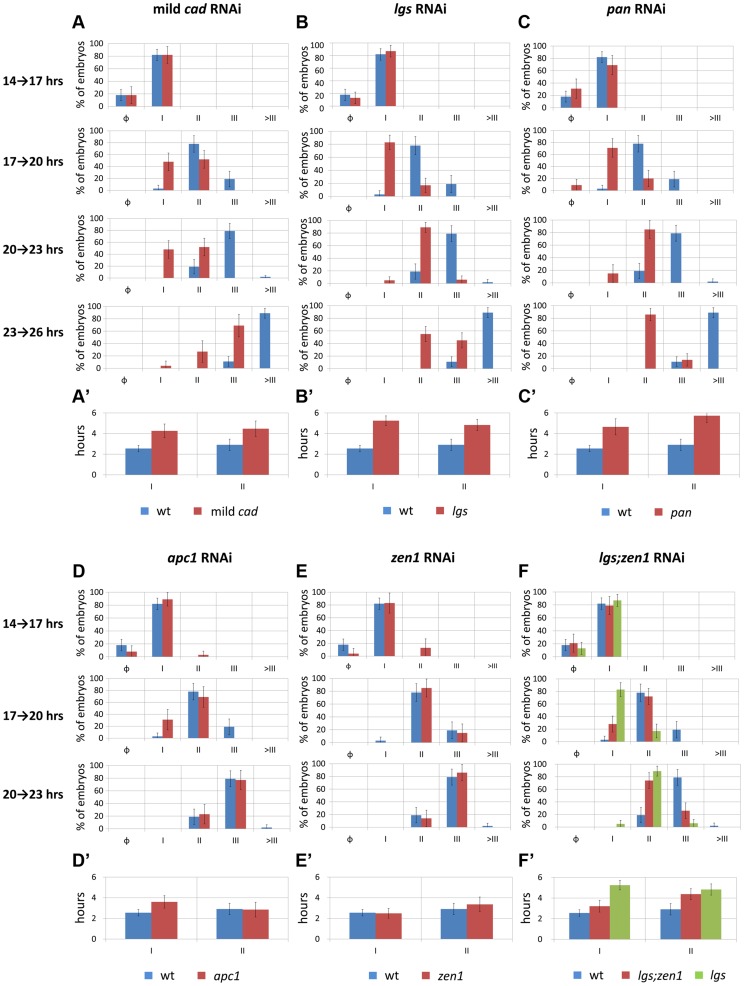
Figure 5. Temporal dynamics of Tc-eve expression at the posterior end of the embryo in WT and RNAi knockdowns.
(A, B, C, D, E, F) percentage distributions of Tc-eve expression classes (classification was based on Tc-eve oscillation cycle in the posterior end, see Figure 3) in different timed egg collections in multiple RNAi knockdowns (red bars) in comparison with WT (blue bars): mild Tc-cad (A), Tc-lgs (B), Tc-pan(C), Tc-apc1(D), Tc-zen1(E), and Tc-lgs;Tc-zen1(F) RNAi embryos. Cycle I embryos are those going from high (phase I.1) to low (phase I.0) Tc-eve expression levels at the posterior end to from the first Tc-eve stripe (Figure 3); cycle II embryos are those going from high (phase II.1) to low (phase II.0) Tc-eve expression levels to form the second Tc-eve stripe (and so on). Class distributions were used to estimate the duration of different Tc-eve oscillation cycles (A′, B′, C′, D′, E′, and F′; see Text S3). Error bars represent 95% confidence intervals.

