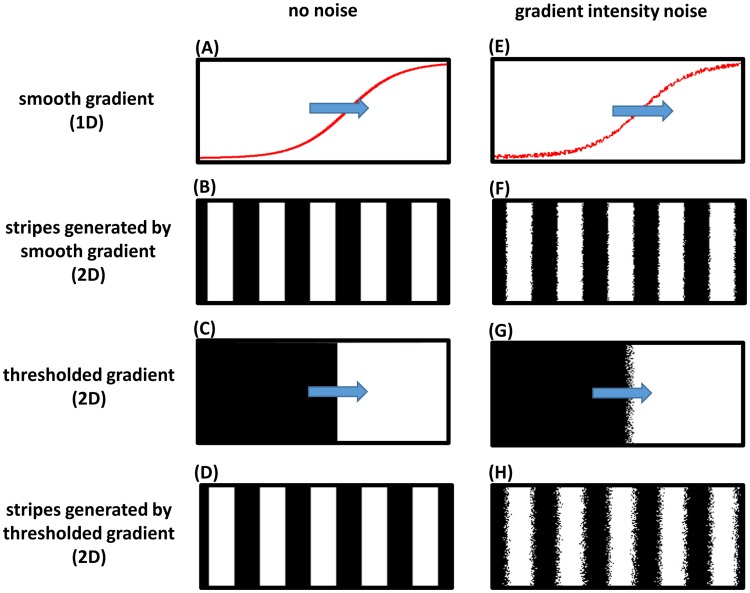
Figure 6. Frequency profile and robustness of the clock-and-wavefront model.
A computer simulation of a two-dimensional (2D) lattice of oscillators (horizontal and vertical axes of the lattice represent the AP and lateral axes of the embryo, respectively; posterior to the right). Each oscillator runs independently with a frequency determined by a smooth spatial gradient that retracts from anterior to posterior, with or without applying a threhold. (A) one-dimensional (1D) lateral cross section of the 2D smooth gradient (see Movies S7 for the 2D version; direction of movement is shown in blue arrow). (B) stripes generated if the smooth gradient shown in (A) is directly applied to the oscillators lattice (high phase of oscillation is shown in white and low phase in black); see Movie S7. (C) a 2D thresholded version of the smooth gradient shown in (A). (D) stripes generated if the thresholded gradient shown in (C) is applied to oscillators lattice; see Movie S8. (E–H) are the same as (A–D) after adding noise to frequency gradient intensity; see Movies S9 and S10. Simulations were performed using Matlab (code is available in Text S2).

