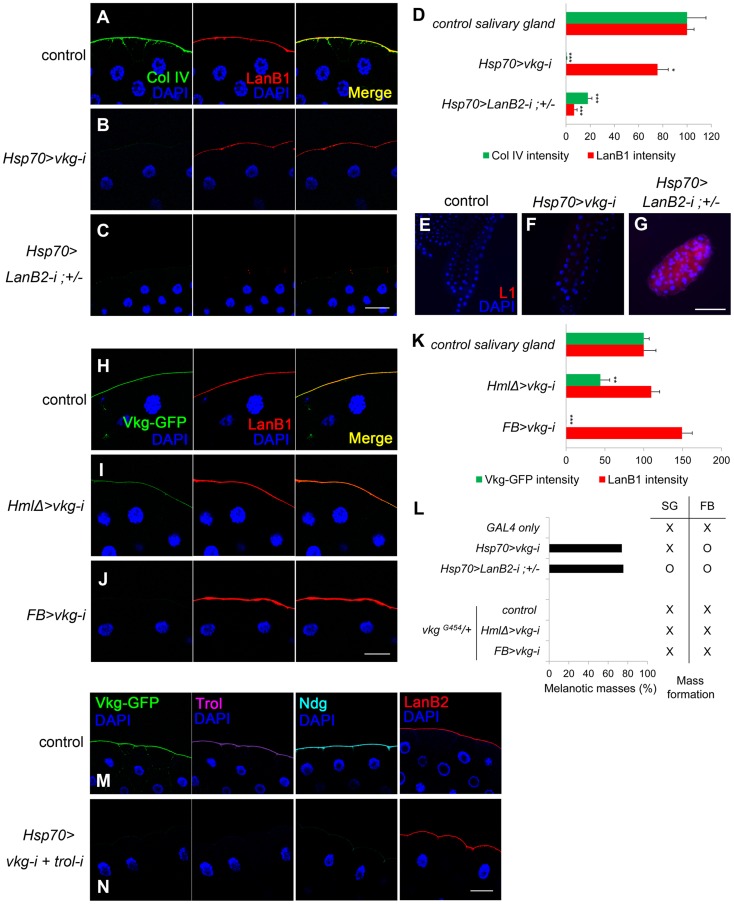
Figure 3. Laminin alone sufficiently blocks melanotic mass formation.
(A–C) Confocal images of salivary-gland BMs after staining for collagen IV (anti-Col IV in green), laminin (anti-LanB1 in red), and nuclei (DAPI in blue). The control is GAL4-only. (D) Quantitation of the fluorescence intensities in (A–C). Error bars represent SEM. *p<0.05, ***p<0.001 by Student's t-test. (E–G) Salivary glands from (A–C) after staining lamellocytes using anti-L1 antibodies (red) and the nuclei with DAPI (blue). (H–J) Confocal images of salivary-gland BMs after visualizing collagen IV using Vkg-GFP (green), laminin using anti-LanB1 antibodies (red), and nuclei using DAPI (blue). HmlΔ-GAL4 and FB-GAL4 drive gene expression in hemocytes the fat body, respectively. The control represents vkgG454/+. (K) Quantitation of the fluorescence intensities in (H–J). Error bars represent SEM. **p<0.01 and ***p<0.001 by Student's t-test. (L) Percentages of larvae containing melanotic masses in (A–C) and (H–J) and their mass-forming positions. SG and FB indicate salivary gland and fat body, respectively. (M, N) Confocal images of the salivary-gland BMs of vkgG454/+ (M) and vkgG454 UAS-vkg-i/+ +; Hsp70-GAL4/UAS-trol-i (N) larvae after visualization of collagen IV using Vkg-GFP (green), Perlecan (Trol) using anti-Trol antibodies (purple), Nidogen using anti-Ndg antibodies (cyan), laminin using anti-LanB2 antibodies (red), and nuclei using DAPI (blue). Scale bar: 50 µm (A–C, H–J, M, N) and 200 µm (E–G).

