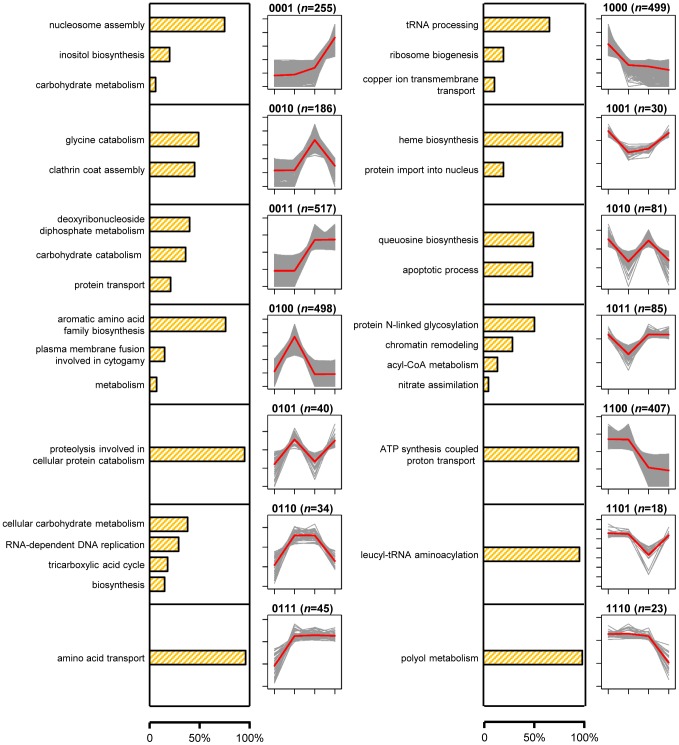
Figure 2. Proportions of genes with the GO term-defined functions and gene expression profiles of 14 signature expression patterns.
Bar plots with orange shading show the proportions of genes in each pattern group with functions defined with the summarized GO terms. Line plots show expression profiles of genes in each pattern group. For each gene, normalized expression levels of four conditions: Y, Y-to-M, M-to-Y, and M, are shown with gray line. For each pattern, the average expression levels of four conditions across all genes with the pattern are shown with red line.

