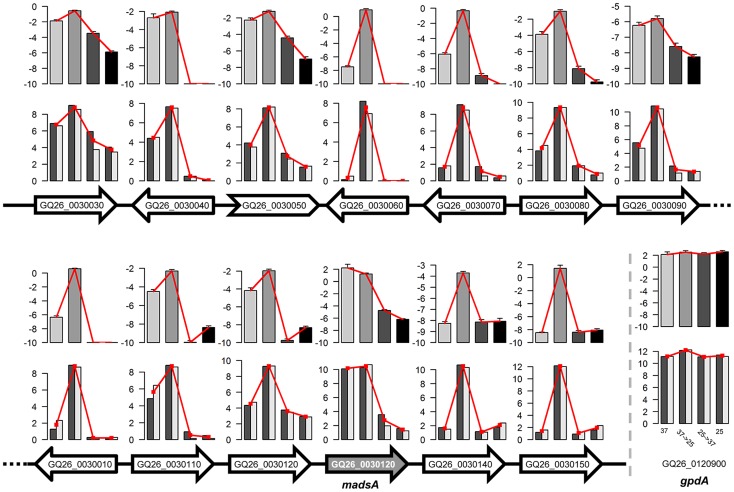
Figure 5. Expression levels of genes in one of expression-pattern clusters.
Arrows represent genes and their transcriptional directions on the scaffold. White filled arrows represent yeast-to-mycelium identity genes in the cluster. The gene GQ26_0030130 (i.e., madsA) and the non-coding gene GQ26_0030050 are indicted with shading and the arrow of different shape. For each gene, two rows of bar plots show the expression levels of the gene under four treatments measured by two replicates of RNA-seq (bottom) and qRT-PCR (top). For the RNA-seq results, log2(FPKM+1) values are shown. For qRT-PCR, the relative gene expression levels (ΔCt to actA) are shown. Insert shows the gene expression levels of a house-keeping gene, gpdA.

