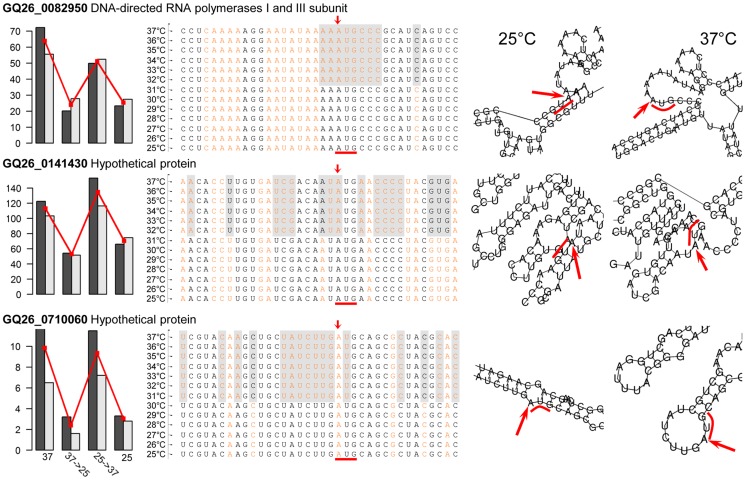
Figure 6. Temperature-induced structural transitions of P. marneffei mRNA transcripts.
Left panels show the expression levels (in FPKM) of three genes with transcripts whose structures are temperature dependent. Middle panels show mRNA sequences with structural annotation for each nucleotides. Nucleotides in the stem structure are shown in black, those in the loop structure are shown in orange. Nucleotides highlighted in gray shadow are those with structural difference at 37°C versus 25°C. Right panels show the computational predictions of the secondary structures of three mRNAs at 25 and 37°C. For each transcript, the translation initiation site is indicated with red arrow and the start codon AUG is indicted with red bar.

