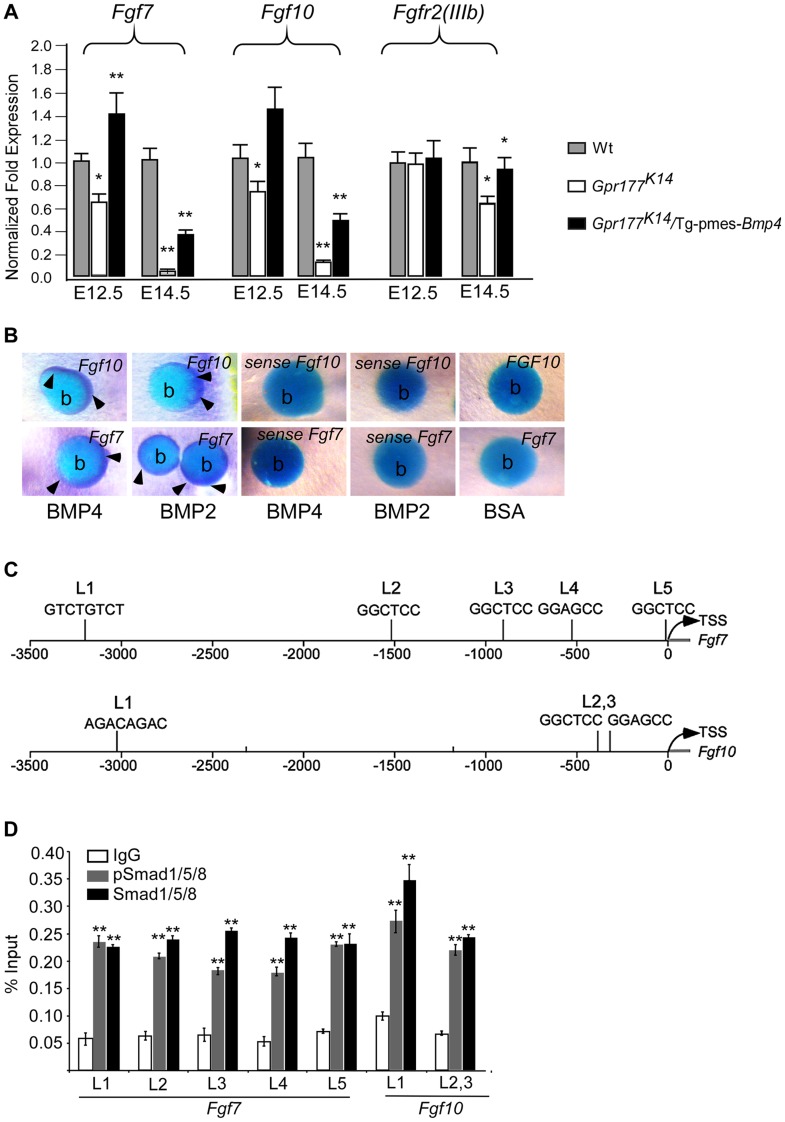
Figure 7. Genetic transduction of BMP signaling via FGF7/FGF10 in dermis to promote epidermal stratification.
(A) Quantitative real-time RT-PCR performed on mRNA isolated from dissected autopod skin at E12.5 (n = 5) and E14.5 (n = 3) reveals reduced expression of Fgf7 and Fgf10. Note that significantly reduced expression of Fgfr2-IIIb isoform is detected at E14.5. *, P<0.05; **, P<0.01, compared with wild type controls. Data are represented as mean ± SD and are representatives of at least 3 independent experiments. (B) Implanted BMP2 and BMP4 protein-soaked beads in dermis explants induces the expression of Fgf7 and Fgf10 (arrowheads) around the protein beads, as shown by whole-mount in situ hybridization. Data are representatives of at least three independent experiments. b: protein beads. sense: sense riboprobes. (C) Schematic diagram shows location of Smad1/5/8-binding sites of the Fgf7 and Fgf10 regulatory region. L1-L5 represents Smad1/5/8-binding site with GGMGCC or GTCTGTCT sequence [41], [42]. (D) Quantitative levels of ChIP assays were analyzed by real-time PCR. ChIP assays were performed with Smad1/5/8 or pSmad1/5/8 antibody. Immunoprecipitated DNA was amplified by real-time PCR and presented as a percentage of input. The data shown are representative of two independent experiments with similar results. Error bar represent standard deviations of the PCR reactions performed in triplicate. Student's t-test was used for statistical analysis. **, P<0.01. L, locus. TSS, Transcription start site. See also Figure S6.

